

Day’s Summary
Tue July 18 saw stocks once again find ready buyers as stocks rallied for yet another day to another new 52 week high.
As more and more investors return to stocks the question is how long the uptrend can last before we see at least a couple of days of pullback.
The SPX closed up 32 points to 4555. The NASDAQ rose 108 points to end the day at 14353.
Trading volume on the SPX jumped higher to 4.1 billion shares while the NASDAQ saw 4.9 billion shares traded.
Both indexes have overbought technical warnings but stocks are continuing to ignore any such signals in its climb.
Let’s review the technical indicators from the close on Tuesday to see what we should expect for Wed Jul 19 2023.
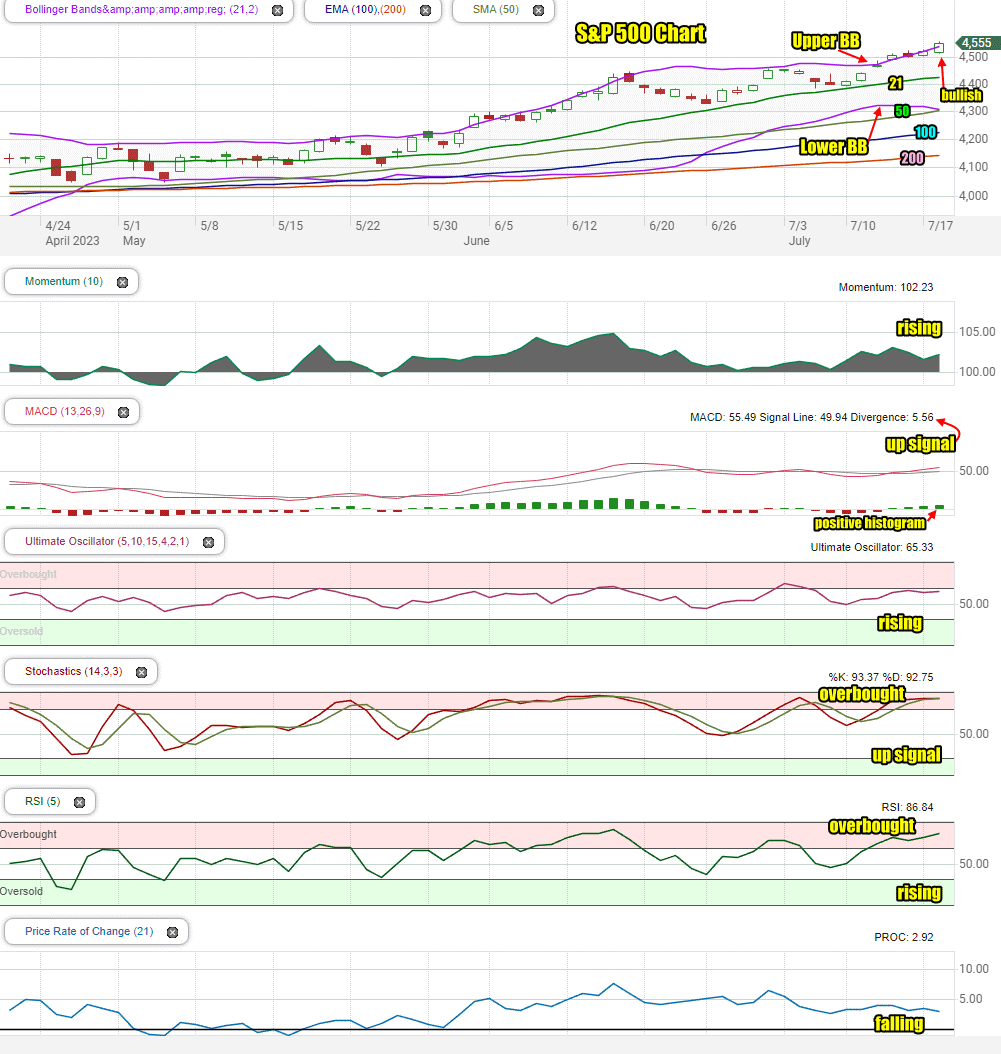
Stock Market Outlook: SPX Closing Chart For Tue Jul 18 2023
The index closed at the Upper Bollinger Band and all moving averages which is bullish.
The closing candlestick on Tuesday is bullish for Wednesday but also is signaling the index is overbought and dips should be expected.
The 21, 50, 100 and 200 day moving averages are continuing to climb which is bullish.
The SPX Bollinger Bands Squeeze is ending as the Lower Bollinger Band is falling and reached the 50 day moving average on Tuesday. The Upper Bollinger Band is rising. This is bullish for stocks.
Stock Market Outlook review of Tue Jul 18 2023
Stock Market Outlook: Technical Indicators Review
Momentum: Momentum is rising and positive.
|
MACD Histogram: MACD (Moving Averages Convergence / Divergence) issued an up signal on Thursday Jul 13. The up signal was stronger on Tuesday.
|
Ultimate Oscillator: The Ultimate Oscillator is rising and near overbought levels.
|
Slow Stochastic: The Slow Stochastic has a weak up signal in place. It is overbought and could issue a down signal by the close on Wednesday.
|
Relative Strength Index: The RSI signal is rising and very overbought.
|
Rate of Change: The rate of change signal is falling which indicates a down day should be coming soon.
|
Stock Market Outlook: Support and Resistance Levels |
| 4600 is resistance |
| 4575 is resistance |
| 4550 is resistance |
| 4525 is resistance |
| 4500 is resistance |
| 4485 is resistance |
| 4470 is resistance |
| 4450 is resistance |
| 4435 is resistance |
| 4420 is resistance |
| 4400 is strong resistance |
| 4390 is resistance |
| 4370 is resistance |
| 4350 is support |
| 4340 is support |
| 4325 is support |
| 4310 is support |
| 4300 is support |
| 4290 is support |
| 4275 is support |
| 4250 is support |
| 4240 is support |
| 4225 is support |
| 4210 is support |
| 4200 is good support |
Stock Market Outlook for Wed Jul 19 2023
For Wednesday the technical indicators are still showing the index as very overbought but with a bullish bias to the upside. That means there could be dips today but they are still opportunities to set up trade as the overall trend remains still higher. The rally has moved quickly once it broke free of 4500 but the SPX can’t keep rising daily. At some point the index will retest 4500 and perhaps as low as 4475 to build some support for the rally to be able to continue this summer. On Wednesday though, the outlook is still for a higher close by the end of the day.
Potential Economic and Political Market Moving Events
Tuesday:
8:30 Retail sales were lower than expected at 0.2%
8:30 Retail sales minus autos was lower than expected at 0.2%
10:00 Home builder confidence index came in at 56 which was near expectations of 57.
Wednesday:
8:30 Housing starts are estimated at 1.48 million
8:30 Building permits are also expected to reach 1.48 million