

On Tuesday a stunning plunge in Goldman Sachs Stock (GS) following the worst quarterly earnings report in perhaps 10 years, hit the Dow Index particularly hard but the broader market exhibited just overbought weakness while the NASDAQ closed positive. These are bullish signs.
The S&P lost just 8 points to close at 3990 in a day of range bound trading at the 200 day moving average.
The NASDAQ climbed 16 points to closed at 11,079.
Overall the market remains strong despite the disappointing Goldman Sachs result. Meanwhile Morgan Stanley Stock (MS) rose almost 6% to $97.08 on better than expected earnings result.
After hours on Tuesday, United Airlines Holdings announced stellar earnings and raised their forward guidance citing strong consumer demand.
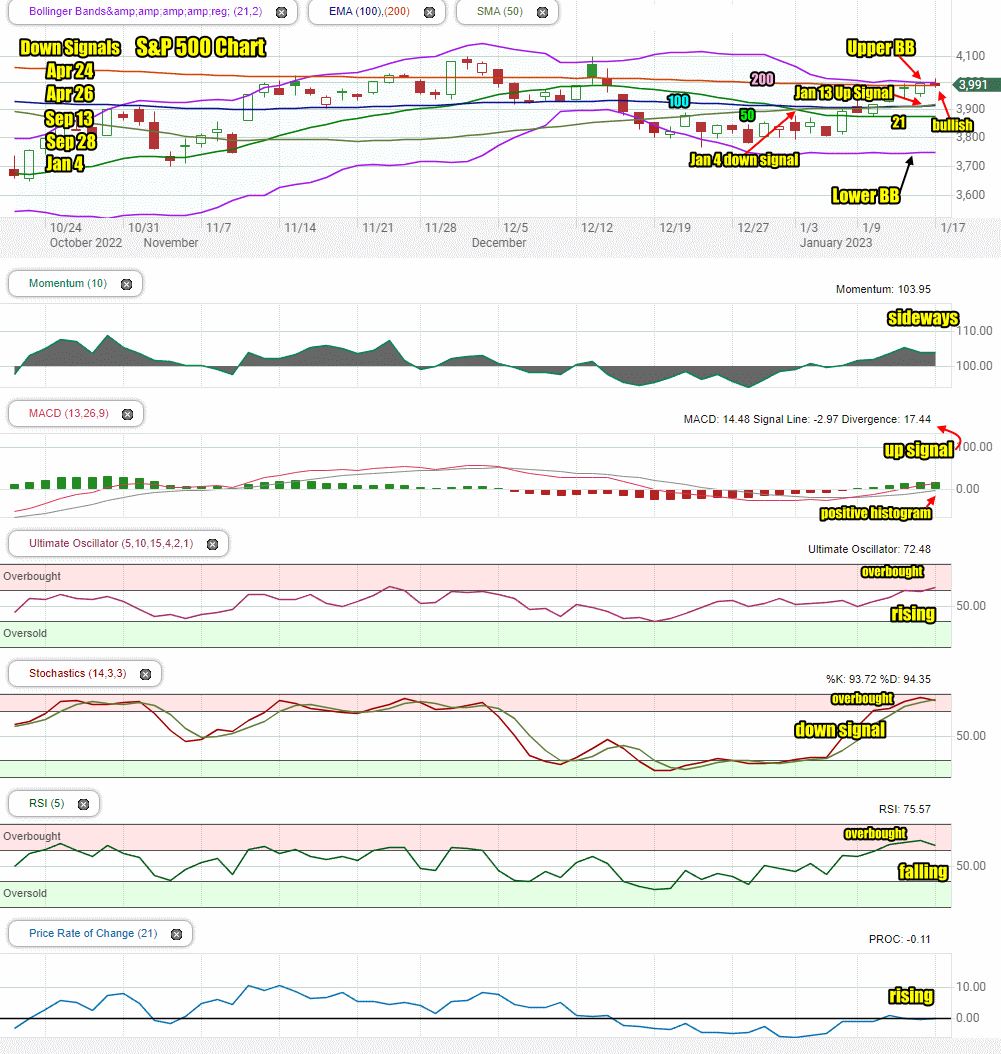
Let’s review the closing technical indicators from the SPX on Tue Jan 17 to see what to expect for Wed Jan 18 2023.
Stock Market Outlook Chart Comments At The Close on Tue Jan 17 2023
On Tue Jan 17 the S&P closed above the 21, 50, 100 and at the 200 day moving averages. This is bullish.
The closing candlestick is bullish for Wednesday but also signals that stocks are overbought and dips are more than likely.
The Upper Bollinger Band is starting to turn lower which is a concern but the Lower Bollinger Band is trending sideways which remains bullish.
The 200 and 100 day moving averages are falling which is bearish but the 21 day is turning back up and the 50 day moved above the 100 day on Friday Jan 13 for a new up signal. This up signal ended the down signal from Dec 30.
At present there are are 5 down signals in place since April 24 and one up signal.
The chart is 55% bearish for Wednesday which is a bit higher percentage than yesterday’s outlook. This is primarily due to the SPX being overbought.
Stock Market Outlook review of Tue Jan 17 2023
Stock Market Outlook: Technical Indicators Review:
Momentum: Momentum is moving sideways but remains positive.
- Settings: For momentum I use a 10 period when studying market direction.
MACD Histogram: MACD (Moving Averages Convergence / Divergence) issued an up signal on Monday Jan 9. The up signal was stronger Tuesday. The histogram also gained strength.
- Settings: For MACD Histogram, I am using the Fast Points set at 13, Slow Points at 26 and Smoothing at 9.
Ultimate Oscillator: The Ultimate Oscillator is rising and positive. It is signaling overbought.
- Settings: The Ultimate Oscillator settings are: Period 1 is 5, Period 2 is 10, Period 3 is 15, Factor 1 is 4, Factor 2 is 2 and Factor 3 is 1. These are not the default settings but are the settings I use with the S&P 500 chart set for 1 to 3 months.
Slow Stochastic: The Slow Stochastic has a weak down signal in place. It too is signaling overbought.
Settings: For the Slow Stochastic I use the K period of 14 and D period of 3. The Slow Stochastic tries to predict the market direction further out than just one day.
Relative Strength Index: The RSI signal is falling and into overbought readings for a fourth day.
- Settings: The relative strength index is set for a period of 5 which gives it 5 days of market movement to monitor. It is often the first indicator to show an overbought or oversold signal.
Rate of Change: The rate of change signal is rising and not quite positive.
- Settings: Rate Of Change is set for a 21 period. This indicator looks back 21 days and compares price action from the past to the present. With the Rate Of Change, prices are rising when signals are positive. Conversely, prices are falling when signals are negative. As an advance rises the Rate Of Change signal should also rise higher, otherwise the rally is suspect. A decline should see the Rate Of Change fall into negative signals. The more negative the signals the stronger the decline.
Support and Resistance Levels To Be Aware Of:
4050 is resistance
4030 is resistance
4025 is resistance
4000 is resistance
3975 is resistance
3965 is resistance
3950 is resistance
3925 is light support
3900 is light support
3875 is light support
3850 is good support
3830 is good support
3810 is light support
3800 is good support
3775 is good support
3750 is good support
3730 is light support
3725 is light support
3715 is light support
3700 is good support
3685 is light support
Stock Market Outlook for Tomorrow – Wed Jan 18 2023
Considering the plunge in Goldman Sachs Stock (GS) of $24 for a 6.4% loss, the broader market held up well losing just 8 points on Tuesday. As well the Empire state manufacturing index came it at a rather stunning -32.9 well below estimates of -7.0. This shows the Fed’s interest rates are affecting the economy. Normally a number this poor would have investors dumping stocks. Instead the broader market held up well. This is a sign of strength.
The market remains bullish and overbought. Today investors get a slew of reports and at 2:00 they get the Fed’s beige book. We could see a wider swing in the SPX today but the outlook remains bullish with dips likely and yet a good chance to close either positive, or with a small loss. I am expecting a lot of weakness intraday especially with the Beige Book and then Harker’s comments as outlined below. They are a lot of reports for investors to “worry over” today.
Potential Economic and Political Market Moving Events
Tuesday:
8:30 Empire state manufacturing index was extremely poor at -32.9 well below estimates of -7.0
Wednesday:
8:30 Retail sales with and without autos
8:30 Producer price index expected at -0.1%
9:15 Industrial production expected at -0.1%
9:15 Capacity utilization expected to be 79.6%. A lower number will advise slowing growth.
9:30 Fed President Bullard is interview at the Wall Street Journal which could dip stocks a bit at the open – if that happens it will be an opportunity to setup trades
10:00 NAHB home builders index is expected to be 30
10:00 Business inventories are expected to come in at 0.4%
2:00 Beige Book – this could swing markets
3:15 Philadelphia Fed President Patrick Harker speaks on the economic outlook – this could send stocks lower depending on how hawkish his comments are
Stock Market Outlook Archives
Stock Market Outlook For Wed May 6 2026 – Choppy But Higher Still

Morning Investing Strategy Notes for Tue May 5 2026

Stock Market Outlook For Tue May 5 2026 – Overbought and Lower

Morning Investing Strategy Notes for Mon May 4 2026
Stock Market Outlook For Mon May 4 2026 – Dips Likely With Possible Lower Close

Morning Investing Strategy Notes for Fri May 1 2026
Stock Market Outlook For Fri May 1 2026 – Overbought But Higher

Morning Investing Strategy Notes for Thu Apr 30 2026
Stock Market Outlook For Thu Apr 30 2026 – Dips Likely Possible Lower Close
Morning Investing Strategy Notes for Wed Apr 29 2026
Stock Market Outlook For Wed Apr 29 2026 – Choppy But Higher Ahead Of More Earnings

Morning Investing Strategy Notes for Tue Apr 28 2026