
What Happened On Tue Jan 16 2018
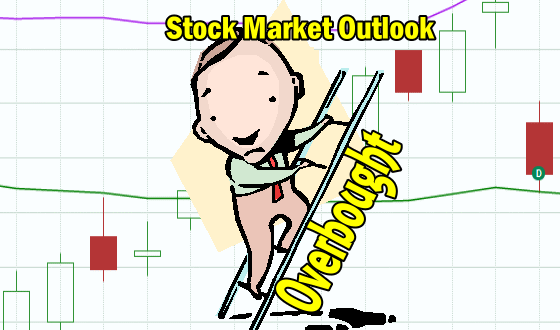
The media spend much of the day on Tuesday trying to give reasons and excuses for why the indexes gave back the early morning rally on Tuesday. In general though the dip was expected as the market over the past 2 weeks had become extremely overbought. Tonight, many stock market analysts are calling the reversal on Tuesday a signal of a much bigger drop that is now underway. I don’t believe that. In my opinion the market is extremely overbought and prices are ahead of themselves. Let’s look at the technical indicators and then see where markets may head on Wednesday.
Closing Statistics for Tue Jan 16 2018
S&P 500 Index Close
The S&P index ended down 9.82 to 2776.42
Dow Jones Index Close
The Dow Jones ended down 10.33 to 25792.86
NASDAQ Index Close
The NASDAQ closed down 37.38 to 7223.69
Stock Market Outlook – Review of Tue Jan 16 2018
Chart Comments At The Close:
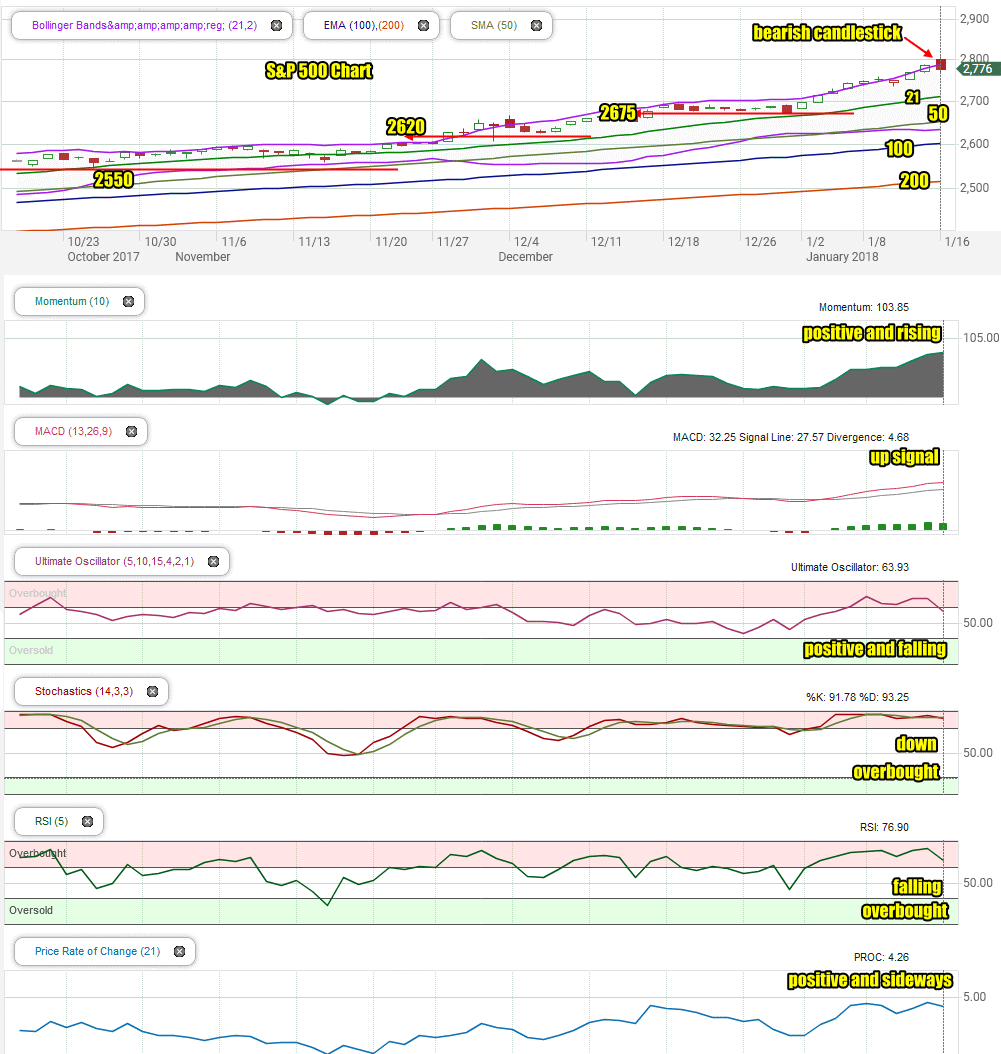
Tuesday saw the S&P open to a new all-time high and by mid-morning, investors could watch the rally slip away. With the S&P above 2800 to 2807, buyers drifted away and the market couldn’t stay elevated without enough buyers. Stocks began to fall. By the end of the day the index was down 0.35% to 2776.42. It closed below the Upper Bollinger Band, leaving behind a bearish candlestick for Wednesday. All the major moving averages are still climbing which is bullish.
Stock Market Outlook review of Tue Jan 16 2018
Stock Market Outlook: Technical Indicators:
Momentum: For momentum I use a 10 period when studying market direction. Momentum is positive and rising.
MACD Histogram: For MACD Histogram, I am using the Fast Points set at 13, Slow Points at 26 and Smoothing at 9. MACD (Moving Averages Convergence / Divergence) issued a buy signal on Jan 4. That buy signal was untouched by the sell-off on Tuesday.
Ultimate Oscillator: The Ultimate Oscillator settings are: Period 1 is 5, Period 2 is 10, Period 3 is 15, Factor 1 is 4, Factor 2 is 2 and Factor 3 is 1. These are not the default settings but are the settings I use with the S&P 500 chart set for 1 to 3 months. The Ultimate Oscillator signal is positive and falling. It is no longer overbought.
Slow Stochastic: For the Slow Stochastic I use the K period of 14 and D period of 3. The Slow Stochastic tries to predict the market direction further out than just one day. The Slow Stochastic is extremely overbought and has a down signal in place for Wednesday.
Relative Strength Index: The relative strength index is set for a period of 5 which gives it 5 days of market movement to monitor. It often is the first indicator to show an overbought or oversold signal. The RSI signal is also extremely overbought and falling.
Rate of Change: Rate Of Change is set for a 21 period. This indicator looks back 21 days and compares price action from the past to the present. The rate of change signal is positive and moving sideways.
Support Levels To Be Aware Of:
2675 and 2620 are light support.
There is good support at the 2550 level.
The S&P has light support at 2480. It also has light support at 2450 and good support at 2425. Below that there is some support at 2400, 2380, 2350. 2300 has the most support at present but would represent a full correction as a drop to this level would be almost 15%.
Stock Market Outlook for Tomorrow – Wed Jan 17 2018
The loss of the rally on Tuesday left some technical damage but overall the indicators are still positive although almost all of them have lost some strength to the upside.
For Wednesday the indicators look like they are expecting a bounce attempt at the open and then we could see more selling. A negative close on Wednesday would not be out of the question although technically, the bias is still higher for stocks for Wednesday.
So we are looking at an extremely overbought market that had a slight bias to move lower. However considering how many investors are waiting for a pullback to get into this market, it is doubtful if any downside action will not be bought into on Wednesday and move the market back to a positive close.
Market Direction Internal Links
Profiting From Understanding Market Direction (Articles Index)
Understanding Short-Term Signals
Market Direction Portfolio Trades (Members)
Market Direction External Links
IWM ETF Russell 2000 Fund Info
Market Direction SPY ETF 500 Fund Info