

Tuesday saw the S&P trade within a very tight trading range of roughly just 4 points. It closed up 1 point or basically unchanged on the day.
Stock Market Outlook Chart Comments At The Close on Tue Dec 17 2019
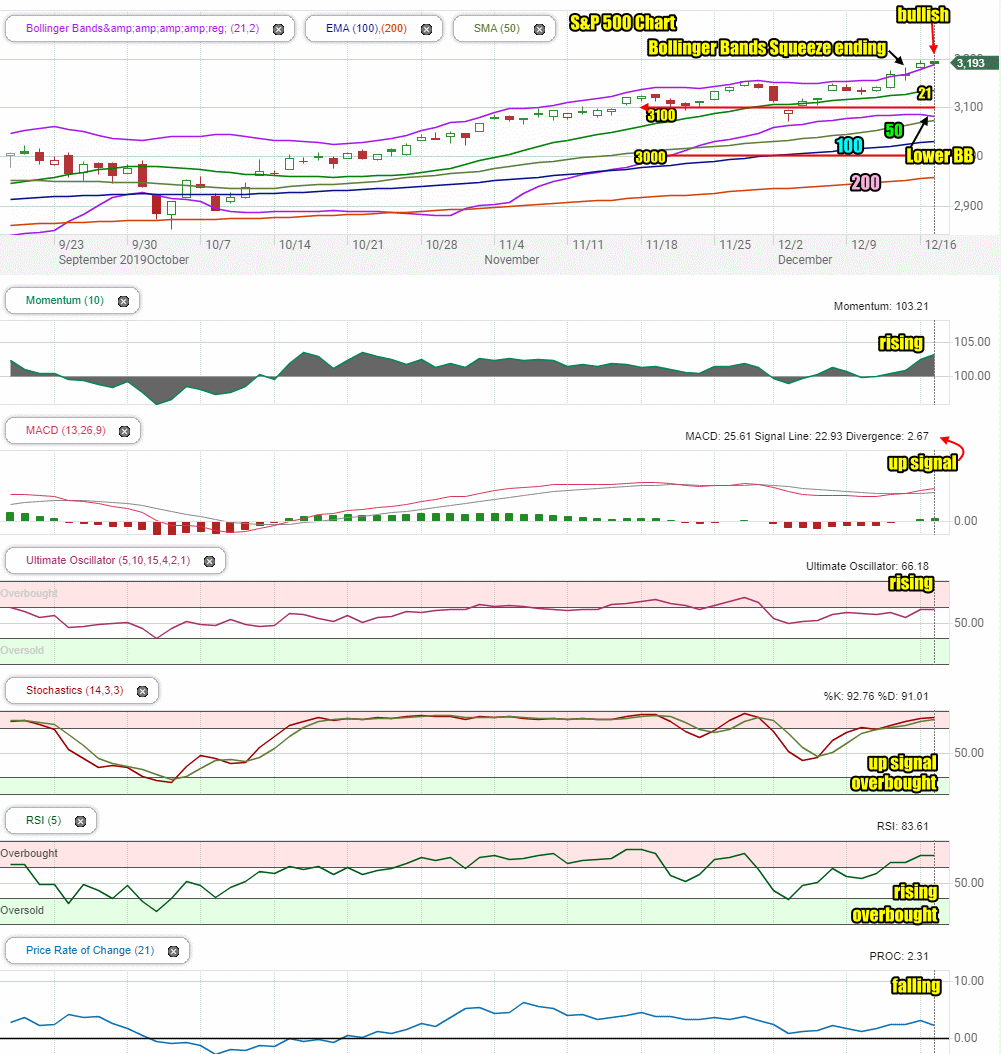
The SPX chart continues to be bullish and the Bollinger Bands Squeeze is ending with signs pointing to a further rise in the index out of the squeeze.
The closing candlestick is bullish for Wednesday.
Despite this all the major moving averages are moving higher and light support has now added in the 3100 level.
Stock Market Outlook review of Tue Dec 17 2019
Stock Market Outlook: Technical Indicators Review:
Momentum: Momentum is rising and positive.
- Settings: For momentum I use a 10 period when studying market direction.
MACD Histogram: MACD (Moving Averages Convergence / Divergence) issued an up signal on Friday Dec 13. On Tues Dec 17, the up signal was stronger.
- Settings: For MACD Histogram, I am using the Fast Points set at 13, Slow Points at 26 and Smoothing at 9.
Ultimate Oscillator: The Ultimate Oscillator signal is rising.
- Settings: The Ultimate Oscillator settings are: Period 1 is 5, Period 2 is 10, Period 3 is 15, Factor 1 is 4, Factor 2 is 2 and Factor 3 is 1. These are not the default settings but are the settings I use with the S&P 500 chart set for 1 to 3 months.
Slow Stochastic: The Slow Stochastic is overbought and has an up signal in place.
- Settings: For the Slow Stochastic I use the K period of 14 and D period of 3. The Slow Stochastic tries to predict the market direction further out than just one day.
Relative Strength Index: The RSI signal is rising and signaling overbought.
- Settings: The relative strength index is set for a period of 5 which gives it 5 days of market movement to monitor. It is often the first indicator to show an overbought or oversold signal.
Rate of Change: The rate of change signal is falling indicating little change in prices is expected.
- Settings: Rate Of Change is set for a 21 period. This indicator looks back 21 days and compares price action from the past to the present. With the Rate Of Change, prices are rising when signals are positive. Conversely, prices are falling when signals are negative. As an advance rises the Rate Of Change signal should also rise higher, otherwise the rally is suspect. A decline should see the Rate Of Change fall into negative signals. The more negative the signals the stronger the decline.
Support and Resistance Levels To Be Aware Of:
3200 is resistance
3100 is light support
3075 is light support
3030 is light support
3000 is support
2960 is light support
2950 was light support
2900 is light support
2860 is light support
2840 is support
2800 is strong support
2795 is light support
2745 to 2750 is light support
2725 is light support
2700 is light support
Stock Market Outlook for Tomorrow – Wed Dec 18 2019
Closing signals on Tuesday point to the market opening flat to weak and dipping lower. FedEx Stock (FDX) earnings disappointed after hours on Tuesday and will, no doubt, bring into question once again, whether the economy will be slowing, especially retail. We will see some stocks in the same sector move lower on Wednesday.
While the opening may be weak, the index will stage another attempt to push higher and end the day higher on Wednesday.
Stock Market Outlook Archives
Stock Market Outlook For Wed May 6 2026 – Choppy But Higher Still

Morning Investing Strategy Notes for Tue May 5 2026

Stock Market Outlook For Tue May 5 2026 – Overbought and Lower

Morning Investing Strategy Notes for Mon May 4 2026
Stock Market Outlook For Mon May 4 2026 – Dips Likely With Possible Lower Close

Morning Investing Strategy Notes for Fri May 1 2026
Stock Market Outlook For Fri May 1 2026 – Overbought But Higher

Morning Investing Strategy Notes for Thu Apr 30 2026
Stock Market Outlook For Thu Apr 30 2026 – Dips Likely Possible Lower Close
Morning Investing Strategy Notes for Wed Apr 29 2026
Stock Market Outlook For Wed Apr 29 2026 – Choppy But Higher Ahead Of More Earnings

Morning Investing Strategy Notes for Tue Apr 28 2026