

Tuesday saw the markets bounce higher off the news of a Covid-19 stimulus bill getting closer to agreement. The S&P rose almost 1.3% to close at 3694, just 6 points shy of 3700.
Stock Market Outlook Chart Comments At The Close on Tue Dec 15 2020
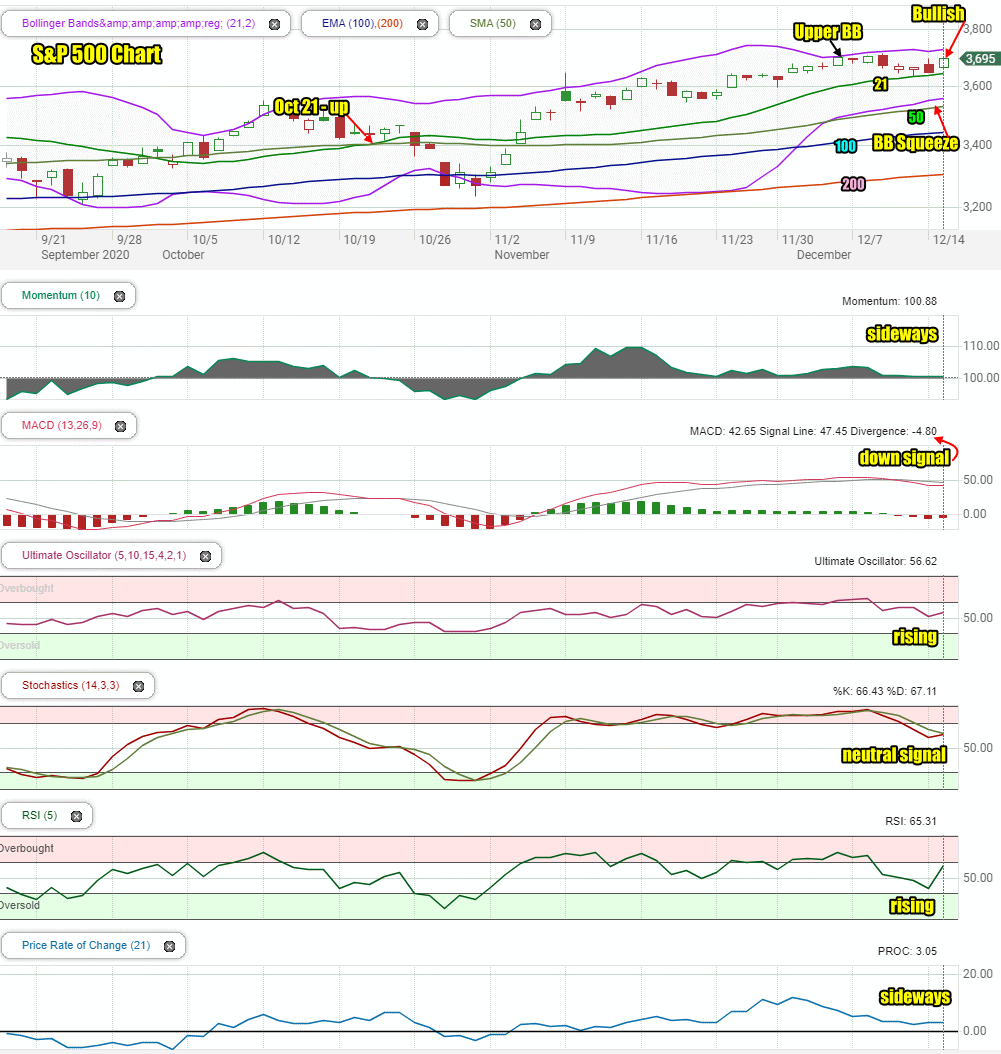
Tuesday saw the index bounce off the 21 day moving average to push higher. This left behind a bullish candlestick for Wednesday.
The Bollinger Bands Squeeze is continuing with the Upper Bollinger Band falling lower and the Lower Bollinger Band continuing to rise.
All the other major moving averages are still rising which continues to suggest that the weakness we are seeing won’t last.
Stock Market Outlook review of Tue Dec 15 2020
Stock Market Outlook: Technical Indicators Review:
Momentum: Momentum is moving sideways and positive.
- Settings: For momentum I use a 10 period when studying market direction.
MACD Histogram: MACD (Moving Averages Convergence / Divergence) issued a a down signal on Dec 10. The down signal was still strong on Tuesday.
- Settings: For MACD Histogram, I am using the Fast Points set at 13, Slow Points at 26 and Smoothing at 9.
Ultimate Oscillator: The Ultimate Oscillator is rising.
- Settings: The Ultimate Oscillator settings are: Period 1 is 5, Period 2 is 10, Period 3 is 15, Factor 1 is 4, Factor 2 is 2 and Factor 3 is 1. These are not the default settings but are the settings I use with the S&P 500 chart set for 1 to 3 months.
Slow Stochastic: The Slow Stochastic has a neutral signal in place after two straight down signals. It is not overbought.
Settings: For the Slow Stochastic I use the K period of 14 and D period of 3. The Slow Stochastic tries to predict the market direction further out than just one day.
Relative Strength Index: The RSI signal is rising sharply.
- Settings: The relative strength index is set for a period of 5 which gives it 5 days of market movement to monitor. It is often the first indicator to show an overbought or oversold signal.
Rate of Change: The rate of change signal has turned sideways, unchanged from Monday.
- Settings: Rate Of Change is set for a 21 period. This indicator looks back 21 days and compares price action from the past to the present. With the Rate Of Change, prices are rising when signals are positive. Conversely, prices are falling when signals are negative. As an advance rises the Rate Of Change signal should also rise higher, otherwise the rally is suspect. A decline should see the Rate Of Change fall into negative signals. The more negative the signals the stronger the decline.
Support and Resistance Levels To Be Aware Of:
3700 is resistance
3600 is light support
3550 is support
3500 is support
3450 is support
3400 is support
3375 is support
3300 is support
3275 is support
3200 is support
3150 is support
3050 is support
3000 is support
Stock Market Outlook for Tomorrow – Wed Dec 16 2020
For Wednesday there are a few changes in the technical indicators that are pointing to another chance for the index to push higher on Wednesday for at least the morning and possibly the close.
The indicators in general though are still signaling there is more weakness still to come. This makes the rally on Tuesday suspect. That means we could see further dips on Wednesday in the S&P but in general the index should try to close above 3700. We should know by the close on Wednesday if the rally is suspect and will drop back, or whether the index can continue to rally higher. Any bad news on the Covid-19 bill will of course see stocks dip but further good news will propel them higher, back above 3700.
Stock Market Outlook Archives
Stock Market Outlook For Wed May 6 2026 – Choppy But Higher Still

Morning Investing Strategy Notes for Tue May 5 2026

Stock Market Outlook For Tue May 5 2026 – Overbought and Lower

Morning Investing Strategy Notes for Mon May 4 2026
Stock Market Outlook For Mon May 4 2026 – Dips Likely With Possible Lower Close

Morning Investing Strategy Notes for Fri May 1 2026
Stock Market Outlook For Fri May 1 2026 – Overbought But Higher

Morning Investing Strategy Notes for Thu Apr 30 2026
Stock Market Outlook For Thu Apr 30 2026 – Dips Likely Possible Lower Close
Morning Investing Strategy Notes for Wed Apr 29 2026
Stock Market Outlook For Wed Apr 29 2026 – Choppy But Higher Ahead Of More Earnings

Morning Investing Strategy Notes for Tue Apr 28 2026