
 Prior Trading Day Summary
On Tuesday stocks spent most of the day in a fairly tight trading range ahead of the Fed interest rate announcement due out today at 2:00 PM. The SPX traded 4.6 billion shares, a 300 million drop from Monday. The index closed down 6 points at 6840.
The NASDAQ rose 30 points, closing at 23,576 on 7.4 billion shares. 60% of volume was trading higher and 53% of all stocks were rising.
Let’s review the closing technical indicators from Tue Dec 9 2025 to see what to expect for Wed Dec 10 2025.
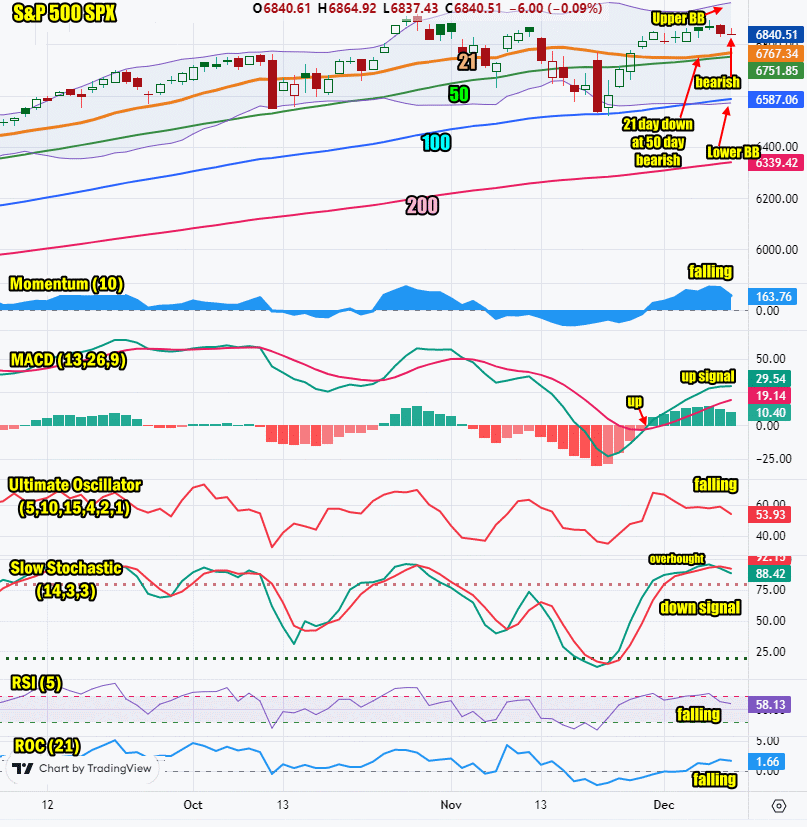
Stock Market Outlook: SPX Closing Chart For Tue Dec 9 2025
The index closed above all major moving averages but below the Upper Bollinger Band and continued the sideways trend for an 8th day. This is bearish but we should see a resolution to the sideways movement today after the interest rate announcement is made.
The closing candlestick is bearish with a long shadow which often signals dips in the morning.
The 21 day moving average is rising and closed at 6767 which is bullish. The 21 day is trying to climb higher, away from the 50 day.
The 50 day moving average is rising and closed at 6751 which is bullish.
The 100 day moving average is rising and closed at 6587 which is bullish.
The 200 day moving average is rising and closed at 6339 which is bullish.
The Lower Bollinger Band is falling and further below the 100 day moving average. This is bearish. The Upper Bollinger Band is moving higher which is bullish.
The SPX chart has a mix of bearish and bullish signals but more signals are bullish.
SPX Stock Market Outlook review of Tue Dec 9 2025
Stock Market Outlook: Technical Indicators Review
Momentum: Momentum is falling but positive which is bearish.
|
MACD Histogram: MACD (Moving Averages Convergence / Divergence) issued an up signal on Fri Nov 28. On Tue Dec 9 2025 the up signal lost strength.
|
Ultimate Oscillator: The Ultimate Oscillator is falling.
|
Slow Stochastic: The Slow Stochastic has a down signal in place and is falling from overbought.
|
Relative Strength Index: The RSI signal is falling.
|
| Rate of Change: The rate of change is falling signaling the index will close lower on Wednesday. Settings: Rate Of Change is set for a 21 period. This indicator looks back 21 days and compares price action from the past to the present. With the Rate Of Change, prices are rising when signals are positive. Conversely, prices are falling when signals are negative. As an advance rises, the Rate Of Change signal should also rise higher, otherwise the rally is suspect. A decline should see the Rate Of Change fall into negative signals. The more negative the signals the stronger the decline. |
Stock Market Outlook: Support and Resistance Levels |
| 6900 is resistance |
| 6875 is resistance |
| 6850 is resistance |
| 6800 is resistance |
| 6775 is resistance |
| 6750 is resistance |
| 6715 is resistance |
| 6700 is resistance |
| 6675 is resistance |
| 6650 is support |
| 6625 is support |
| 6600 is support |
| 6590 is support |
| 6570 is support |
| 6550 is support |
| 6500 is support |
Stock Market Outlook for Wed Dec 10 2025
For Wed Dec 10 2025 the morning could see some weakness but overall the day belongs to the Fed until the interest rate announcement at 2:00 PM. Then we could see the technical signals having some effect. They are pointing to a bit lower. However if the rate cut comes as anticipated by over 80% of analysts, the SPX should rise.
The outlook is for the SPX to end the day higher unless the Fed does not cut interest rates. Often the market makes a bigger move, up or down, during the Fed’s 2:30 news conference.
Potential Economic and Political Market Moving Events
Monday:
no announcements or reports
Tuesday:
10:00 Job openings delayed info for Oct was higher than estimated, coming in at 7.7 million versus 7.2 million prior
Wednesday:
2:00 FOMC interest rate decision
2:30 Fed Chair Powell speaks at his news conference