

On Tue Apr 13 2021 the S&P climbed again in a rather see-saw day. By the end of the day the index closed at another new high, ending the day up 13 points to 4141, down just 7 points from reaching 4148 intraday.
The NASDAQ moved higher to close at 13,966 just 175 points from its all-time high.
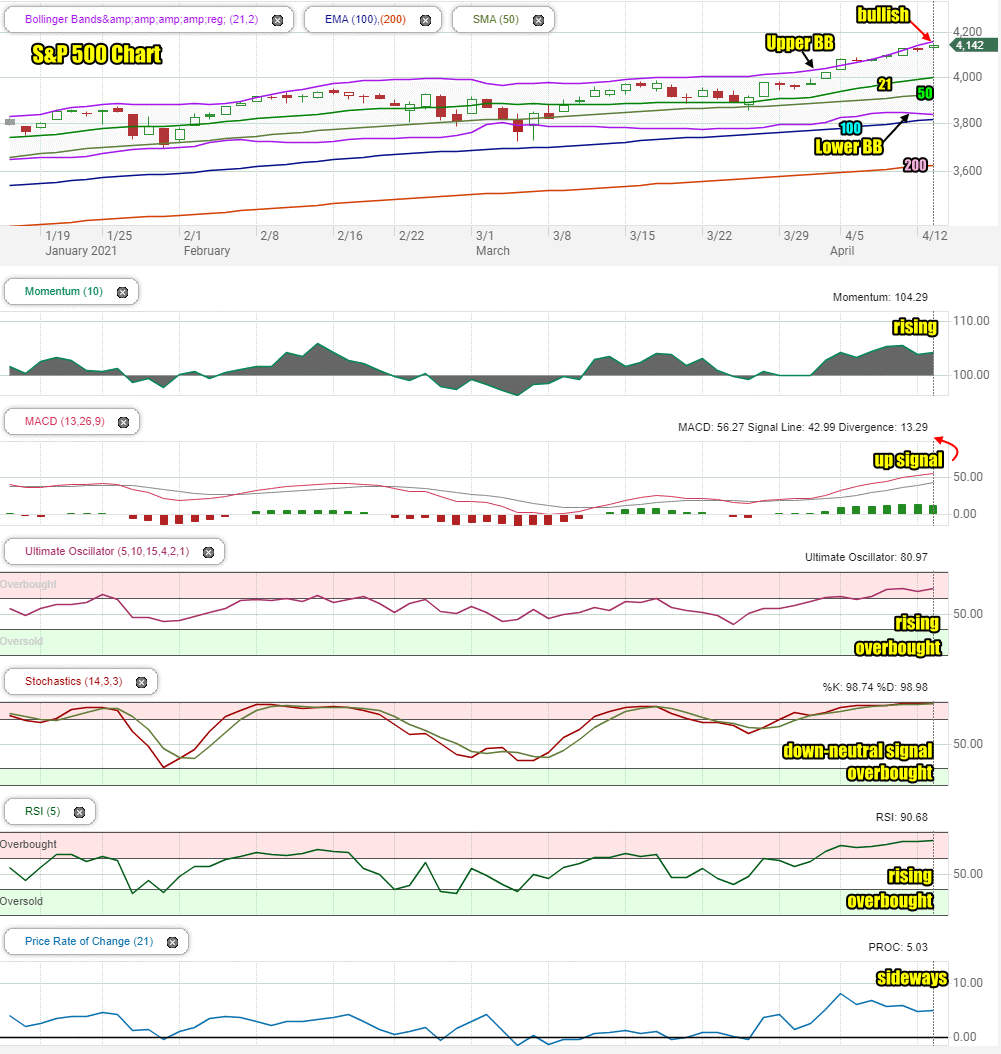
Let’s review the technical indicators are the close on Tuesday to see what we should expect for Wednesday.
Stock Market Outlook Chart Comments At The Close on Tue Apr 13 2021
The Upper Bollinger Band is continuing to rise which is bullish. The index on Thursday closed just below the Upper Bollinger Band signaling the market remains overbought. This is the sixth overbought signal from the SPX chart and shows an extremely overbought index.
The Lower Bollinger Band is falling and could move below the 100 day which is bullish.
The closing candlestick on Tuesday is bullish for Wednesday.
The 21 day moving average is climbing higher away further away from the 50 day moving average which is bullish.
The 50, 100 and 200 day moving averages are all climbing higher.
Overall the S&P chart is very bullish and signaling overbought for a sixth straight day.
Stock Market Outlook review of Tue Apr 13 2021
Stock Market Outlook: Technical Indicators Review:
Momentum: Momentum is positive and rising.
- Settings: For momentum I use a 10 period when studying market direction.
MACD Histogram: MACD (Moving Averages Convergence / Divergence) issued an up signal on Monday March 29 2021. On Tuesday the up signal was still quite strong but is not gaining further strength.
- Settings: For MACD Histogram, I am using the Fast Points set at 13, Slow Points at 26 and Smoothing at 9.
Ultimate Oscillator: The Ultimate Oscillator is rising and signaling overbought.
- Settings: The Ultimate Oscillator settings are: Period 1 is 5, Period 2 is 10, Period 3 is 15, Factor 1 is 4, Factor 2 is 2 and Factor 3 is 1. These are not the default settings but are the settings I use with the S&P 500 chart set for 1 to 3 months.
Slow Stochastic: The Slow Stochastic has an updown to neutral signal in place and is extremely overbought.
Settings: For the Slow Stochastic I use the K period of 14 and D period of 3. The Slow Stochastic tries to predict the market direction further out than just one day.
Relative Strength Index: The RSI signal is rising and overbought.
- Settings: The relative strength index is set for a period of 5 which gives it 5 days of market movement to monitor. It is often the first indicator to show an overbought or oversold signal.
Rate of Change: The rate of change signal is trending sideways.
- Settings: Rate Of Change is set for a 21 period. This indicator looks back 21 days and compares price action from the past to the present. With the Rate Of Change, prices are rising when signals are positive. Conversely, prices are falling when signals are negative. As an advance rises the Rate Of Change signal should also rise higher, otherwise the rally is suspect. A decline should see the Rate Of Change fall into negative signals. The more negative the signals the stronger the decline.
Support and Resistance Levels To Be Aware Of:
4100 is light support
4070 is very light support
4050 is light support
4000 is Support
3900 is support and the 50 day is just above this at 3933.
3850 is support
3800 is support and the 100 day is just above this level.
3750 is good support
3700 is light support
3680 is light support
3600 is strong support and the 200 day is just above this level.
Stock Market Outlook for Tomorrow – Wed Apr 14 2021
The index is extremely overbought and there are signals indicating investors should expect more dips and possibly deeper ones.
The inflation report on Tuesday didn’t weigh on the market although it showed a jump, which had been expected. Many analysts consider the jump in inflation a “blip” while a handful advised that inflation would continue to stay. On Tuesday investors were in the “blip” camp and treasury yields did not fluctuate much. A sharpening rise in the 10 year treasury would jolt stocks at for now that seems to not be in the cards. That could however change.
The Moving Average Convergence / Divergence indicator shows strength in the up signal starting to weaken which is usual before a down day.
The Slow Stochastic has a down to neutral signal and is registering extremely overbought signals.
The Rate Of Change is moving sideways indicating investors should not expect dramatic price changes.
Overall the indicators are advising to be prepared for dips but once again, dips will be opportunities as the outlook remains strongly bullish for Wednesday.
Stock Market Outlook Archives
Stock Market Outlook For Wed May 6 2026 – Choppy But Higher Still

Morning Investing Strategy Notes for Tue May 5 2026

Stock Market Outlook For Tue May 5 2026 – Overbought and Lower

Morning Investing Strategy Notes for Mon May 4 2026
Stock Market Outlook For Mon May 4 2026 – Dips Likely With Possible Lower Close

Morning Investing Strategy Notes for Fri May 1 2026
Stock Market Outlook For Fri May 1 2026 – Overbought But Higher

Morning Investing Strategy Notes for Thu Apr 30 2026
Stock Market Outlook For Thu Apr 30 2026 – Dips Likely Possible Lower Close
Morning Investing Strategy Notes for Wed Apr 29 2026
Stock Market Outlook For Wed Apr 29 2026 – Choppy But Higher Ahead Of More Earnings

Morning Investing Strategy Notes for Tue Apr 28 2026