
Thursday’s blow off resulted in a bounce higher at the open on Friday and then a plunge still deeper taking the S&P down to 3350 by 10:30. That though, proved to be the bottom. Buyers returned and the index spent the rest of the day climbing higher. The close was still negative but the technical readings by the close saw the index down 28 points at 3426. The August unemployment report was better than estimated and the national unemployment rate fell to 8.4% which ended up being the second largest one month plunge recorded. June 2020 recorded the biggest one month decline in unemployment, in history as the pandemic has placed so many people out of work. But signs on Friday’s unemployment report for August, did point to further gains into September for those looking to return to work.
Stock Market Outlook Chart Comments At The Close on Fri Sep 4 2020
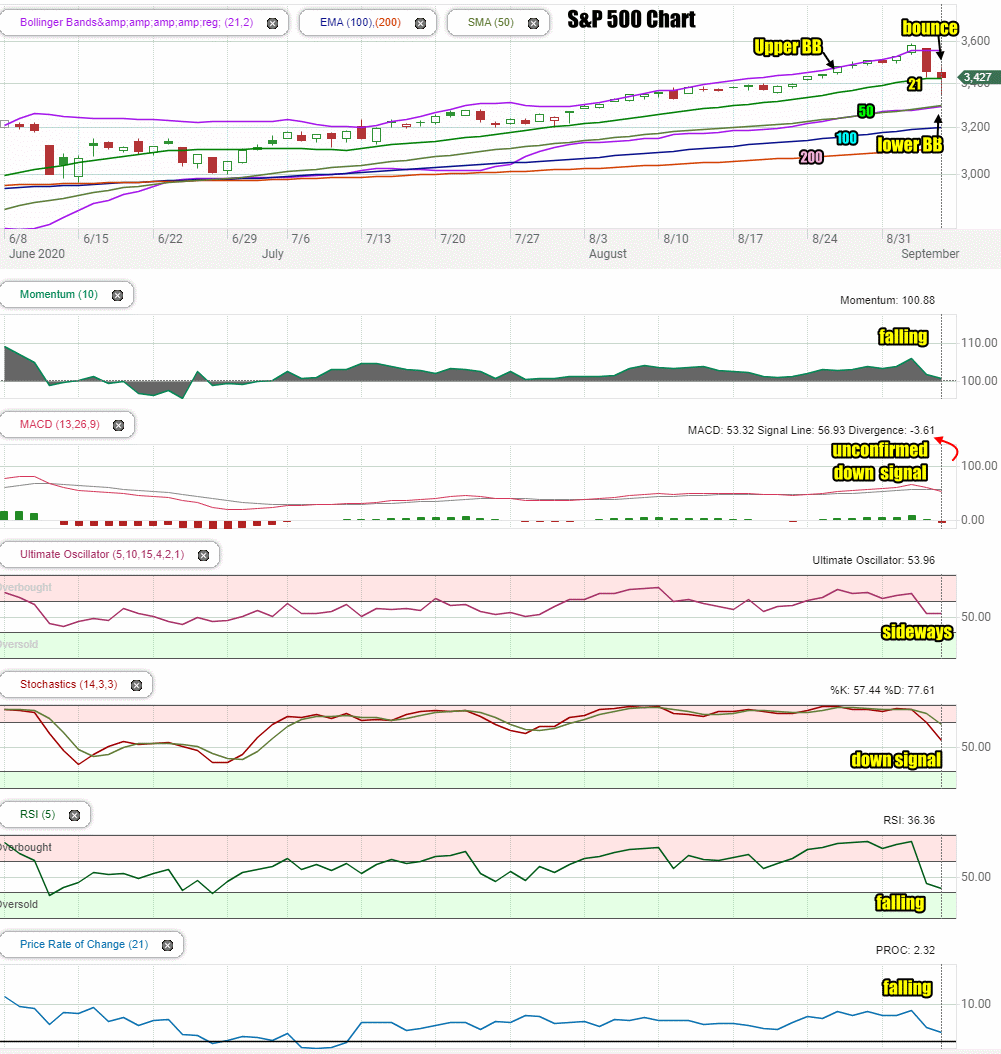
On Friday the closing candlestick is bearish but also signals the potential for another bounce attempt on Monday.
The Lower Bollinger Band is back just below the 50 day moving average again.
There are still 6 up signals and two down signal caused when the Lower Bollinger Band movied above the 100 day moving average back on July 27 and on Aug 31 above the 50 day.
The 21, 50, 100 and 200 day moving averages are continuing to climb. The SPX chart is still bullish but the index on Friday fell below the 21 day and pushed toward the 50 day moving average before a move back to close at the 21 day.
Stock Market Outlook review of For Sep 4 2020
Stock Market Outlook: Technical Indicators Review:
Momentum: Momentum is falling.
- Settings: For momentum I use a 10 period when studying market direction.
MACD Histogram: MACD (Moving Averages Convergence / Divergence) issued an up signal on Monday Aug 24. On Friday MACD issued an unconfirmed, strong down signal.
- Settings: For MACD Histogram, I am using the Fast Points set at 13, Slow Points at 26 and Smoothing at 9.
Ultimate Oscillator: The Ultimate Oscillator is trending sideways.
- Settings: The Ultimate Oscillator settings are: Period 1 is 5, Period 2 is 10, Period 3 is 15, Factor 1 is 4, Factor 2 is 2 and Factor 3 is 1. These are not the default settings but are the settings I use with the S&P 500 chart set for 1 to 3 months.
Slow Stochastic: The Slow Stochastic has a strong down signal in place but is not overbought.
Settings: For the Slow Stochastic I use the K period of 14 and D period of 3. The Slow Stochastic tries to predict the market direction further out than just one day.
Relative Strength Index: The RSI signal is falling.
- Settings: The relative strength index is set for a period of 5 which gives it 5 days of market movement to monitor. It is often the first indicator to show an overbought or oversold signal.
Rate of Change: The rate of change signal is falling indicating we shouldn’t expect big moves on Monday in prices.
- Settings: Rate Of Change is set for a 21 period. This indicator looks back 21 days and compares price action from the past to the present. With the Rate Of Change, prices are rising when signals are positive. Conversely, prices are falling when signals are negative. As an advance rises the Rate Of Change signal should also rise higher, otherwise the rally is suspect. A decline should see the Rate Of Change fall into negative signals. The more negative the signals the stronger the decline.
Support and Resistance Levels To Be Aware Of:
3600 is resistance
3500 is resistance
3450 is support
3400 is support
3375 is support
3300 is support
3275 is support
3200 is support
3150 is support
3050 is support
3000 is support
2975 is light support
2950 is light support
2900 is light support
Stock Market Outlook for Tomorrow – Tue Sep 8 2020
For Tuesday the chart shows a good chance for another bounce attempt to arrive for the start of a shortened week.
Despite this, the Moving Average Convergence / Divergence and the Slow Stochastic are both signaling lower although the Moving Average Convergence / Divergence signal is not confirmed.
Surprisingly, the 50 day moving average has risen just above the Lower Bollinger Band which is often a signal that the selling will end.
For Monday there is a good chance for a positive close but the MACD sell signal cannot be ignored. Monday could see the index open higher, climb and then sell lower before finding a closing price somewhere slightly above Friday’s close.
For Monday then, look for a rally, some selling and then a possibly slightly higher close.
Stock Market Outlook Archives
Stock Market Outlook For Wed May 6 2026 – Choppy But Higher Still

Morning Investing Strategy Notes for Tue May 5 2026

Stock Market Outlook For Tue May 5 2026 – Overbought and Lower

Morning Investing Strategy Notes for Mon May 4 2026
Stock Market Outlook For Mon May 4 2026 – Dips Likely With Possible Lower Close

Morning Investing Strategy Notes for Fri May 1 2026
Stock Market Outlook For Fri May 1 2026 – Overbought But Higher

Morning Investing Strategy Notes for Thu Apr 30 2026
Stock Market Outlook For Thu Apr 30 2026 – Dips Likely Possible Lower Close
Morning Investing Strategy Notes for Wed Apr 29 2026
Stock Market Outlook For Wed Apr 29 2026 – Choppy But Higher Ahead Of More Earnings

Morning Investing Strategy Notes for Tue Apr 28 2026