

The indexes are still overbought heading into Tuesday. Monday saw a wide ranging day which ended with an afternoon drop and a negative close.
Stock Market Outlook Chart Comments At The Close on Mon Oct 7 2019
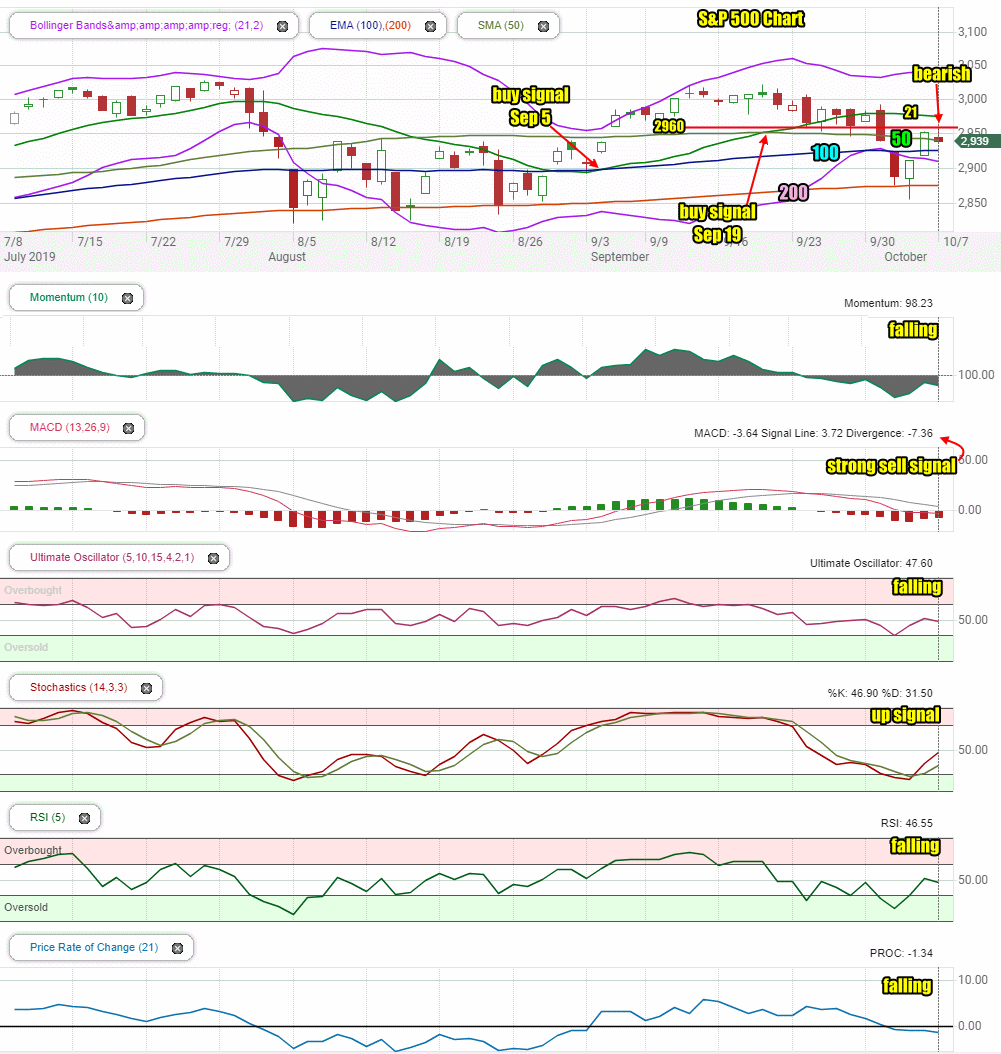
The 21 day moving average is still falling followed by the 50 day moving average.
The index tried to rally but ended the day back at the 50 day moving average. This left behind a bearish candlestick for Tuesday.
You can also see that the Lower Bollinger Band is turning back up which is bullish.
The 50 and 100 day moving averages are still turning lower but the 200 day moving average is still climbing.
The two buy signals from September are still in place.
On Monday the index reached the 2960 level but found resistance from sellers. Tuesday should see another attempt to reach 2960.
Stock Market Outlook review of Mon Oct 7 2019
Stock Market Outlook: Technical Indicators Review:
Momentum: Momentum is falling and not oversold.
- Settings: For momentum I use a 10 period when studying market direction.
MACD Histogram: MACD (Moving Averages Convergence / Divergence) issued down signal on Fri Sep 27 2019. The down signal was still dominant on Monday.
- Settings: For MACD Histogram, I am using the Fast Points set at 13, Slow Points at 26 and Smoothing at 9.
Ultimate Oscillator: The Ultimate Oscillator signal is falling and negative.
- Settings: The Ultimate Oscillator settings are: Period 1 is 5, Period 2 is 10, Period 3 is 15, Factor 1 is 4, Factor 2 is 2 and Factor 3 is 1. These are not the default settings but are the settings I use with the S&P 500 chart set for 1 to 3 months.
Slow Stochastic: The Slow Stochastic has a strong up signal in place is not oversold.
- Settings: For the Slow Stochastic I use the K period of 14 and D period of 3. The Slow Stochastic tries to predict the market direction further out than just one day.
Relative Strength Index: The RSI signal is falling.
- Settings: The relative strength index is set for a period of 5 which gives it 5 days of market movement to monitor. It is often the first indicator to show an overbought or oversold signal.
Rate of Change: The rate of change signal is falling.
- Settings: Rate Of Change is set for a 21 period. This indicator looks back 21 days and compares price action from the past to the present. With the Rate Of Change, prices are rising when signals are positive. Conversely, prices are falling when signals are negative. As an advance rises the Rate Of Change signal should also rise higher, otherwise the rally is suspect. A decline should see the Rate Of Change fall into negative signals. The more negative the signals the stronger the decline.
Support and Resistance Levels To Be Aware Of:
3000 is resistance
2960 was good support
2950 was light support
2900 is light support
2860 is light support
2840 is support
2800 is strong support
2795 is light support
2745 to 2750 is light support
2725 is light support
2700 is light support
2675 is light support
2650 is support
2625 is light support
2600 is support.
Stock Market Outlook for Tomorrow – Tue Oct 8 2019
The technical indicators have shifted to having only one up signal (slow stochastic) with all the other indicators falling.
Much of this though is due to the rally on Thursday and especially Friday which pushed the indexes too high, too quickly.
Tuesday should see another rally attempt. This one should be near the open and the index may try to reach 2960 during the day.
Another negative close may seem likely based on the weak technical signals, however the chance of a positive close is fairly high.
At present the indexes are at the whim of emotion caught around the trade talks with China. Any good news should send stocks higher. Bad new will see stocks move lower.
Markets on Tuesday then should be choppy with dips likely but the close should be higher.
Stock Market Outlook Archives
Stock Market Outlook For Wed May 6 2026 – Choppy But Higher Still

Morning Investing Strategy Notes for Tue May 5 2026

Stock Market Outlook For Tue May 5 2026 – Overbought and Lower

Morning Investing Strategy Notes for Mon May 4 2026
Stock Market Outlook For Mon May 4 2026 – Dips Likely With Possible Lower Close

Morning Investing Strategy Notes for Fri May 1 2026
Stock Market Outlook For Fri May 1 2026 – Overbought But Higher

Morning Investing Strategy Notes for Thu Apr 30 2026
Stock Market Outlook For Thu Apr 30 2026 – Dips Likely Possible Lower Close
Morning Investing Strategy Notes for Wed Apr 29 2026
Stock Market Outlook For Wed Apr 29 2026 – Choppy But Higher Ahead Of More Earnings

Morning Investing Strategy Notes for Tue Apr 28 2026