
Investors on Monday were sidetracked by a number of events. These included a plunge in Merck Stock (MRK) which also took down much of the health care sector. Other events included the drama of Federal Indictments being leyed against two former Trump aides. Last was talk that the tax reform package which includes tax reductions may be gradually phased-in. All of this kept investors on the sidelines and stocks fell back from their all-time highs.
S&P 500 Index Close
The S&P index ended down 8.24 to 2,572.83
Dow Jones Index Close
The Dow Jones ended down 85.45 to 23,348.74
NASDAQ Index Close
The NASDAQ closed down 2.30 to 6698.96
Stock Market Outlook
Stock Market Outlook review of Mon Oct 30 2017
Chart Comments At The Close:
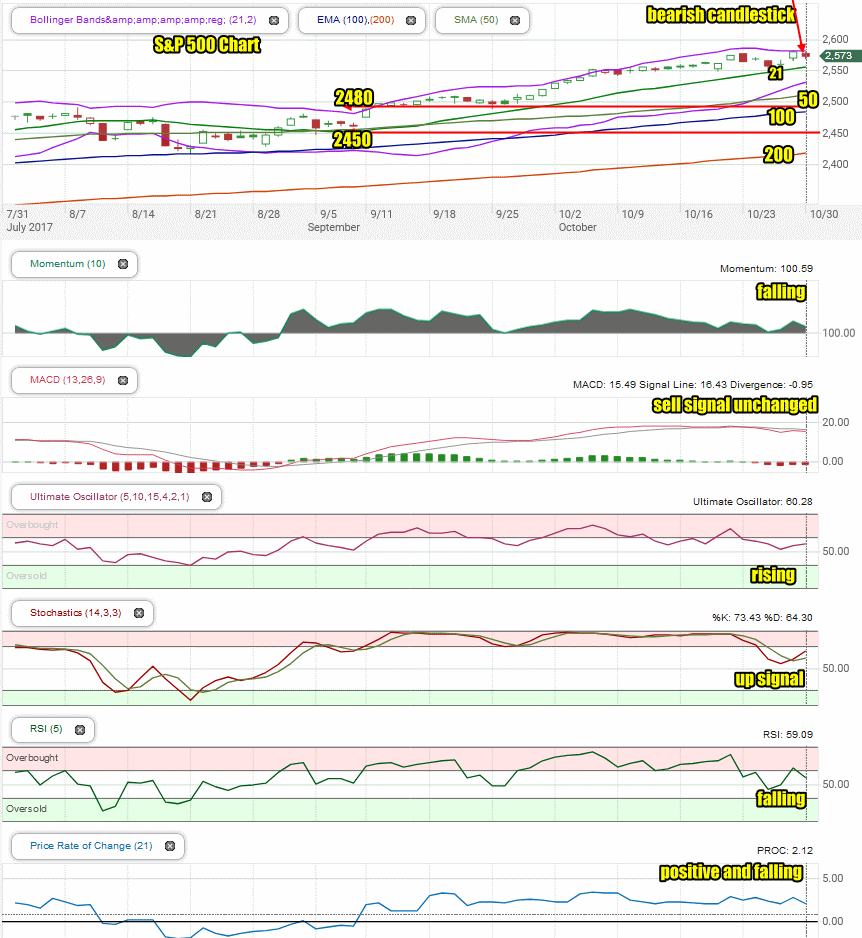
The S&P on Monday pulled back and left behind a bearish candlestick for Tuesday.
The Upper Bollinger Band is still falling and the Lower Bollinger Band is rising, as the S&P is entering a Bollinger Bands Squeeze which could send the market either up or down. My guess is up.
All the major moving averages are continuing to rise which is bullish.
Stock Market Outlook: Technical Indicators:
Momentum: For momentum I use a 10 period when studying market direction. Momentum is falling.
MACD Histogram: For MACD Histogram, I am using the Fast Points set at 13, Slow Points at 26 and Smoothing at 9. MACD (Moving Averages Convergence / Divergence) issued a sell signal on Oct 24. The sell signal was weak and unchanged on Monday and could become a buy signal if the S&P can move higher.
Ultimate Oscillator: The Ultimate Oscillator settings are: Period 1 is 5, Period 2 is 10, Period 3 is 15, Factor 1 is 4, Factor 2 is 2 and Factor 3 is 1. These are not the default settings but are the settings I use with the S&P 500 chart set for 1 to 3 months. The Ultimate Oscillator is positive, and and still rising.
Slow Stochastic: For the Slow Stochastic I use the K period of 14 and D period of 3. The Slow Stochastic tries to predict the market direction further out than just one day. The Slow Stochastic still has an up signal inplace.
Relative Strength Index: The relative strength index is set for a period of 5 which gives it 5 days of market movement to monitor. It often is the first indicator to show an overbought or oversold signal. The RSI signal is pulling back.
Rate of Change: Rate Of Change is set for a 21 period. This indicator looks back 21 days and compares price action from the past to the present. The rate of change signal is positive falling slightly.
Support Levels To Be Aware Of:
The S&P has light support at 2480. It has light support at 2450 and good support at 2425. There is also light support at 2400, 2380, 2350 and 2300.
Stock Market Outlook for Tomorrow – Tue Oct 31 2017
Technically he S&P is still quite strong and pointing to the upside. We could see a bit more weakness on Tuesday but for now the technical indicators are advising that any weakness is an opportunity to setup more trades.
Tuesday should be positive but even if it ends negative the bias remains to the upside for the S&P.
Stay FullyInformed With Email Updates
Market Direction Internal Links
Profiting From Understanding Market Direction (Articles Index)
Understanding Short-Term Signals
Market Direction Portfolio Trades (Members)
Market Direction External Links
IWM ETF Russell 2000 Fund Info
Market Direction SPY ETF 500 Fund Info