

Indexes continued to climb on Monday. The S&P broke above 3800 late in the day and closed just below it but the signals for a higher day on Tuesday are in place as you can see in the stock market outlook for Tuesday.
Tuesday we get results from a number of big name stocks which are expected to beat estimates. That will send the market still higher on Tuesday.
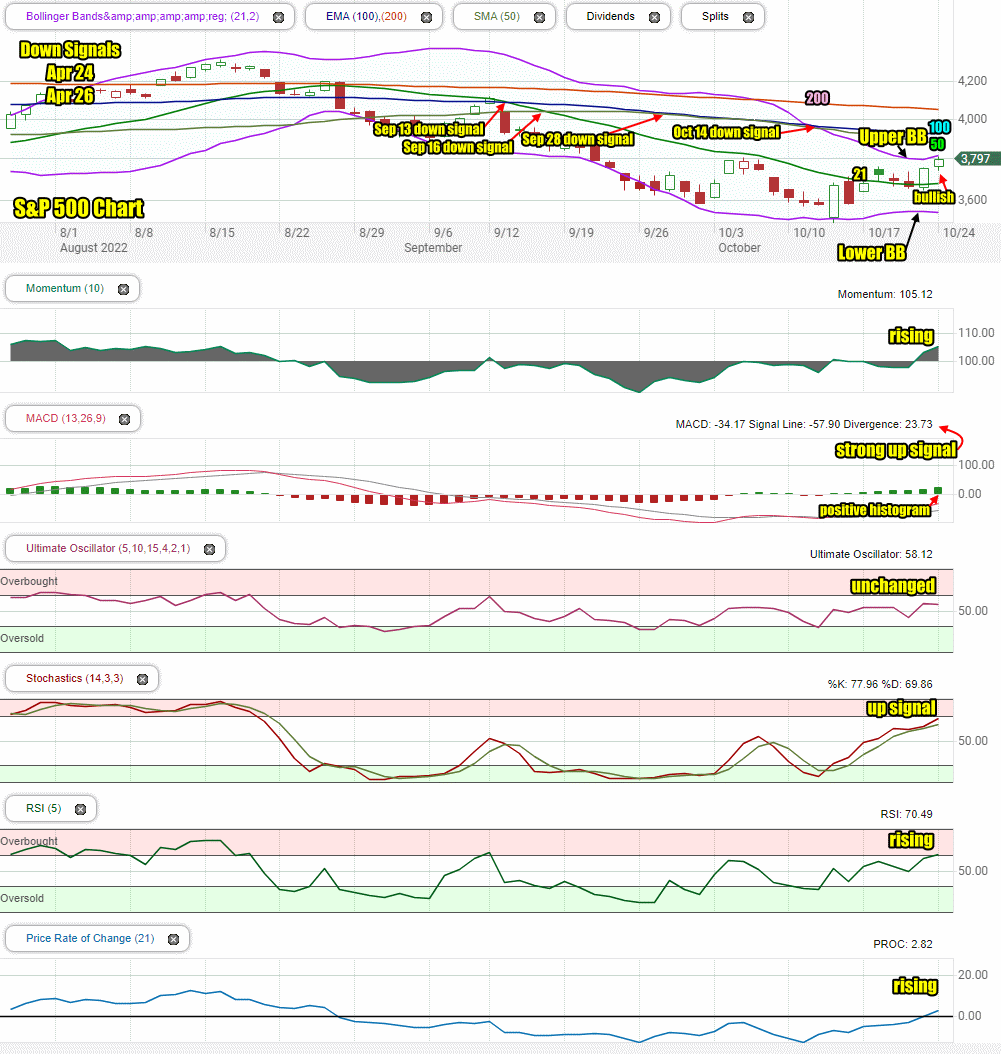
On Monday the S&P closed up 44 points at 3797 and ready to move higher.
The NASDAQ closed up 93 points to end the day at 10,952 and ready to move above 11,000.
Let’s review the closing technical indicators from Mon Oct 24 2022 to see what to expect for Tue Oct 25 2022.
Stock Market Outlook Chart Comments At The Close on Mon Oct 24 2022
On Monday the S&P closing candlestick is above the 21 day and at the Upper Bollinger Band. There are long shadows in the candlestick that advises Tuesday will be choppy. The candlestick though is bullish for Tuesday.
The Bollinger Bands Squeeze looks set to push stocks higher which is bullish.
The 21 day moving average is turning higher which is bullish.
The Upper Bollinger Band is rising and the the Lower Bollinger Band is pulling back. Both are bullish signals.
All the remaining moving averages are still falling which is bearish.
There are now 7 down signals in place since April and no up signals.
The chart is 60% bearish for Tuesday which is the best showing in weeks for the bulls.
Stock Market Outlook review of Mon Oct 24 2022
Stock Market Outlook: Technical Indicators Review:
Momentum: Momentum is rising and positive
- Settings: For momentum I use a 10 period when studying market direction.
MACD Histogram: MACD (Moving Averages Convergence / Divergence) issued an up signal on Thursday Oct 16. On Monday the up signal gained a lot of strength. The histogram also gained more strength.
- Settings: For MACD Histogram, I am using the Fast Points set at 13, Slow Points at 26 and Smoothing at 9.
Ultimate Oscillator: The Ultimate Oscillator is unchanged and positive.
- Settings: The Ultimate Oscillator settings are: Period 1 is 5, Period 2 is 10, Period 3 is 15, Factor 1 is 4, Factor 2 is 2 and Factor 3 is 1. These are not the default settings but are the settings I use with the S&P 500 chart set for 1 to 3 months.
Slow Stochastic: The Slow Stochastic has an up signal in place and getting close to signaling overbought.
Settings: For the Slow Stochastic I use the K period of 14 and D period of 3. The Slow Stochastic tries to predict the market direction further out than just one day.
Relative Strength Index: The RSI signal is rising sharply and positive. It is entering overbought readings.
- Settings: The relative strength index is set for a period of 5 which gives it 5 days of market movement to monitor. It is often the first indicator to show an overbought or oversold signal.
Rate of Change: The rate of change signal is rising and back positive. This is a strong up signal for the index.
- Settings: Rate Of Change is set for a 21 period. This indicator looks back 21 days and compares price action from the past to the present. With the Rate Of Change, prices are rising when signals are positive. Conversely, prices are falling when signals are negative. As an advance rises the Rate Of Change signal should also rise higher, otherwise the rally is suspect. A decline should see the Rate Of Change fall into negative signals. The more negative the signals the stronger the decline.
Support and Resistance Levels To Be Aware Of:
3900 is resistance
3875 is resistance
3850 is resistance
3825 is resistance
3800 is resistance
3775 is light resistance
3750 is light resistance
3730 is light resistance
3700 is light resistance
3675 is light support
3650 is light support
3625 is light support
3600 is good support and is a decline of 25%
Stock Market Outlook for Tomorrow – Tue Oct 25 2022
For Tuesday the technical signals are advising that the index is set to push above 3800. The up signal are gaining a lot of strength and we could see the index move above 3850 shortly.
In the morning Investing Strategy Notes for Monday I indicated I would be buying SPY calls on any morning dip. This was done on Monday at 10:30.
On Tuesday we could see dips but we should see a higher open and a higher close.
Potential Market Moving Events
This week the best market moving events are the earnings announcements. However there are a number of economic events that may have some impact especially on Friday when investors are treated to a number of inflation reports.
Tuesday:
9:00 Case-Shiller home price index
10:00 Consumer confidence index
Stock Market Outlook Archives
Stock Market Outlook For Wed May 6 2026 – Choppy But Higher Still

Morning Investing Strategy Notes for Tue May 5 2026

Stock Market Outlook For Tue May 5 2026 – Overbought and Lower

Morning Investing Strategy Notes for Mon May 4 2026
Stock Market Outlook For Mon May 4 2026 – Dips Likely With Possible Lower Close

Morning Investing Strategy Notes for Fri May 1 2026
Stock Market Outlook For Fri May 1 2026 – Overbought But Higher

Morning Investing Strategy Notes for Thu Apr 30 2026
Stock Market Outlook For Thu Apr 30 2026 – Dips Likely Possible Lower Close
Morning Investing Strategy Notes for Wed Apr 29 2026
Stock Market Outlook For Wed Apr 29 2026 – Choppy But Higher Ahead Of More Earnings

Morning Investing Strategy Notes for Tue Apr 28 2026