
Prior Trading Day Summary
On Monday markets opened and fell to below 4200 before they rallied back as Treasury yields dipped lower on the back of comments by Bill Ackman that they had covered their bond short position. The late afternoon however saw buyers take advantage of the bounce and unload more shares. The day ended with a loss of 7 points and a close at 4217 but the index was well off the early morning lows. Volume was light at 3.8 billion shares traded but there were just 7 new highs and 454 new lows.
The NASDAQ managed to close up, gaining 34 points to end at 13018. Volume rose to 4.8 billion above Friday’s volume. New highs though were just 10 while new lows rose to 544.
With new lows increasing, technically often stocks are nearer the bottom of a sell-off than the top.
The close on Monday saw the MACD (Moving Average Convergence / Divergence) technical indicator confirm Friday’s down signal.
Let’s review the closing technical indicators from Mon Oct 23 2023 to see what to expect for Tue Oct 24 2023.
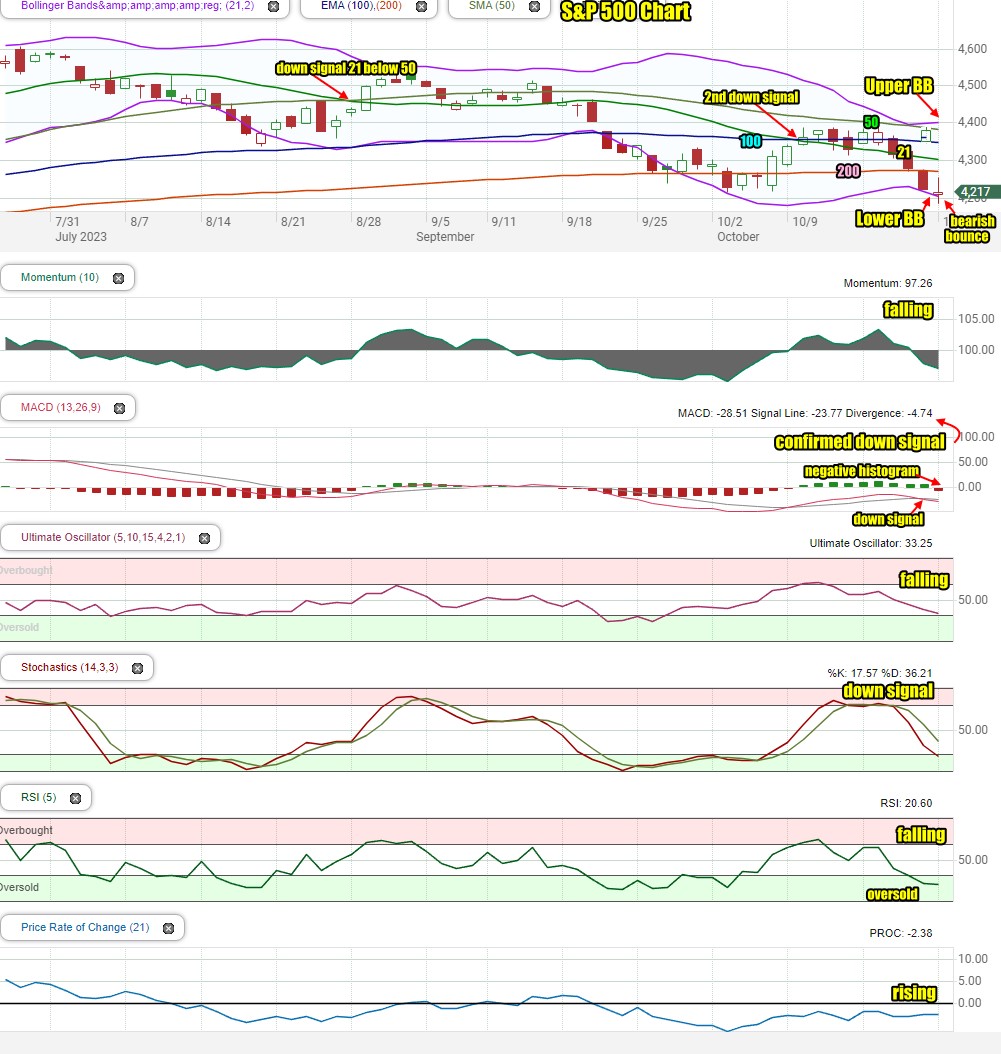
Stock Market Outlook: SPX Closing Chart For Mon Oct 23 2023
The index closed below all major moving averages which is bearish.
The closing candlestick is bearish for Tuesday but also is typical of a bounce signal.
The 21, 50 and 100 day moving averages are all falling. This is bearish. The 21 day moving average is nearing the 200 day.
The 200 day moving average is turning sideways which is bearish.
The Lower Bollinger Band is turning lower which is bearish and could signal more downside to come. The Upper Bollinger Band is also turning sideways and the Bollinger Bands Squeeze may end with the index falling lower.
The S&P chart is quite bearish. There is a good chance for a second attempt at a bounce.
Stock Market Outlook review of Mon Oct 23 2023
Stock Market Outlook: Technical Indicators Review
Momentum: Momentum is falling and negative.
|
MACD Histogram: MACD (Moving Averages Convergence / Divergence) issued a down signal on Fri Oct 20 2023. On Mon Oct 23 2023 the down signal was confirmed.
|
Ultimate Oscillator: The Ultimate Oscillator is falling and negative. It is near oversold readings.
|
Slow Stochastic: The Slow Stochastic has a down signal in place and falling. It is near oversold readings.
|
Relative Strength Index: The RSI signal is falling and negative. It is signaling oversold.
|
Rate of Change: The rate of change signal is rising and negative. A bounce could occur anytime.
|
Stock Market Outlook: Support and Resistance Levels |
| 4450 is resistance |
| 4435 is resistance |
| 4420 is resistance |
| 4400 is resistance |
| 4390 is resistance |
| 4370 is resistance |
| 4350 is resistance |
| 4325 is resistance |
| 4300 is support |
| 4275 is support |
| 4250 is good support |
| 4235 is support |
| 4225 is support |
| 4200 is good support |
| 4185 is support |
| 4175 is support |
| 4150 is good support |
Stock Market Outlook for Tue Oct 24 2023
The technical indicators are signaling a lower day for Tuesday, in what is a very bearish market. They also however, are signaling there is a chance for another bounce attempt.
On Tuesday investors get the latest S&P flash US services PMI and manufacturing PMI. As long as the numbers meet estimates the index should try for a second bounce. If the numbers miss, we could see the indexes slip again.
Potential Economic and Political Market Moving Events
The most important reports this week are services PMI on Tuesday, durable goods orders on Thursday and PCE on Friday. Any of these could move markets.
Monday:
There are no economic reports
Tuesday:
9:45 S&P flash US services PMI s expected to be 49.9
9:45 S&P flash US manufacturing PMI is expected to be 49.0