
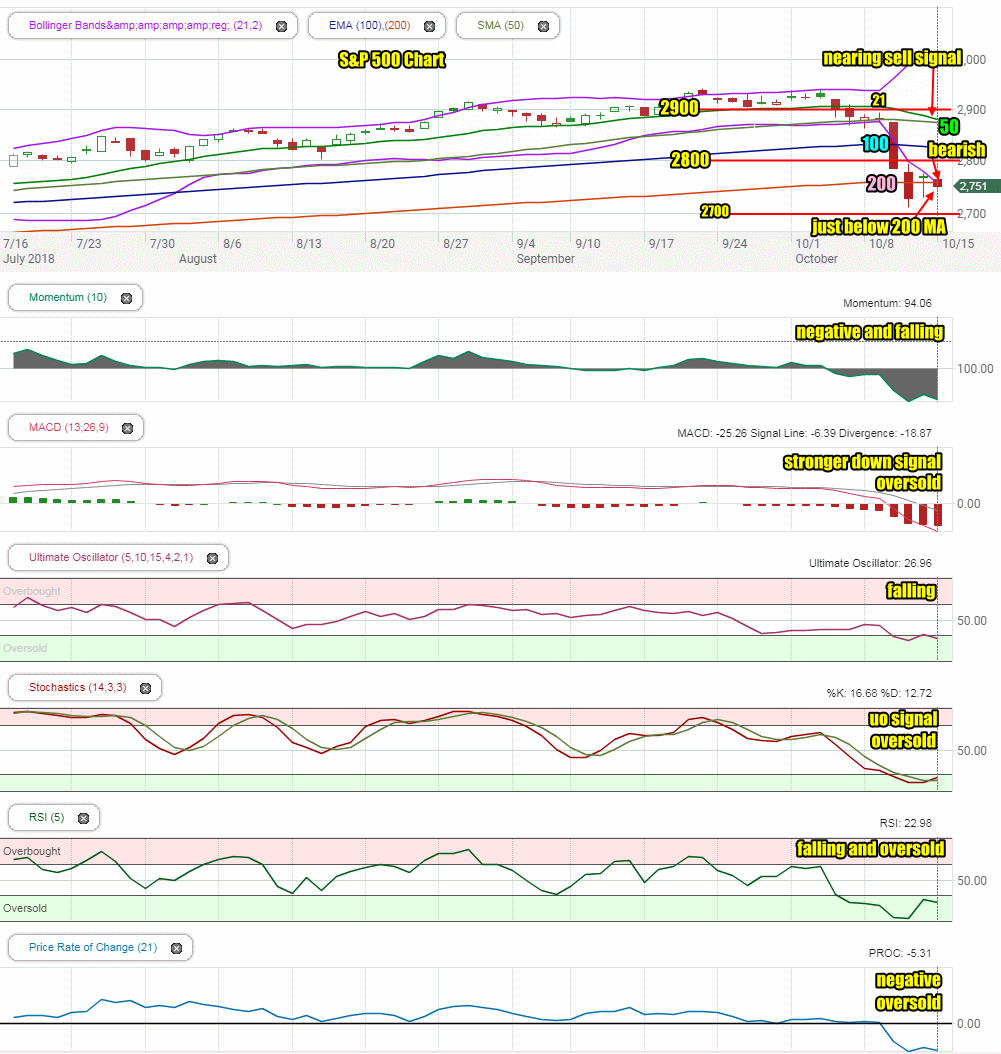
Monday saw the S&P struggle to hold the 200 day moving average. For half the day it traded above the 200 day and for the other half, below it. By the close the S&P was lower and just below the 200 day moving average.
Tuesday is an important day for the indexes but Wednesday is pivotal. The index is entering the latest quarterly earnings season. At this point in the correction, stocks cannot miss earnings estimates.
Stock Market Outlook Chart Comments At The Close on Mon Oct 15 2018
The index closed just below the 200 day moving average on Monday. It traded in a fairly wide range between 2750 and 2770 in a rather roller coaster fashion.
The lower close left the 21 day nearing a sell signal by moving closer to falling below the 50 day. Both the 100 and 200 day moving averages are turning lower. The chart is bearish and the closing candlestick is also bearish.
Stock Market Outlook review of Mon Oct 15 2018
Stock Market Outlook: Technical Indicators Review:
All indicators are strongly bearish for Monday morning.
Momentum: Momentum is oversold and falling.
- Settings: For momentum I use a 10 period when studying market direction.
MACD Histogram: MACD (Moving Averages Convergence / Divergence) issued a down signal on Wednesday Sep 26. While it is oversold, the signal is still very negative.
- Settings: For MACD Histogram, I am using the Fast Points set at 13, Slow Points at 26 and Smoothing at 9.
Ultimate Oscillator: The Ultimate Oscillator signal is is falling.
- Settings: The Ultimate Oscillator settings are: Period 1 is 5, Period 2 is 10, Period 3 is 15, Factor 1 is 4, Factor 2 is 2 and Factor 3 is 1. These are not the default settings but are the settings I use with the S&P 500 chart set for 1 to 3 months.
Slow Stochastic: The Slow Stochastic issued a relatively strong up signal at the close of trading on Monday. This could be the first signal of a better rebound attempt coming shortly.
- Settings: For the Slow Stochastic I use the K period of 14 and D period of 3. The Slow Stochastic tries to predict the market direction further out than just one day.
Relative Strength Index: The RSI signal fell back on Monday and is still oversold.
- Settings: The relative strength index is set for a period of 5 which gives it 5 days of market movement to monitor. It is often the first indicator to show an overbought or oversold signal.
Rate of Change: The rate of change signal is deeply oversold and remains negative indicating lower prices are ahead.
- Settings: Rate Of Change is set for a 21 period. This indicator looks back 21 days and compares price action from the past to the present. With the Rate Of Change, prices are rising when signals are positive. Conversely, prices are falling when signals are negative. As an advance rises the Rate Of Change signal should also rise higher, otherwise the rally is suspect. A decline should see the Rate Of Change fall into negative signals. The more negative the signals the stronger the decline.
Support Resistance Levels To Be Aware Of:
2900 was good support – this will be strong resistance
2860 was good support – this will be resistance
2830 was light support and will be light resistance
2795 was light support and will now be resistance
2745 to 2750 is light support that could easily be recovered
2725 is light support.
2700 is important support.
2675 is light support.
2650 is light support
2620 is light support
2600 is strong support.
There is good support at the 2550 level from where the market bounced back from the recent correction low on Feb 9.
The S&P has light support at 2480. It also has light support at 2450 and good support at 2425. Below that there is some support at 2400, 2380, 2350. 2300 has the most support at present but would represent a full correction as a drop to this level would be 20% and just 5% away from a potential bear market signal.
Stock Market Outlook for Tomorrow – Tue Oct 16 2018
The most encouraging sign is from the Slow Stochastic which has an up signal in place as of Monday’s close. We could indeed see a bounce attempt near the open or even at the open as the S&P managed to hold the 2750 valuation into Monday’s close. That could get the bounce started.
The bounce though won’t last according to the other technical indicators. They are signaling further weakness for the index, despite the up signal from the Slow Stochastic.
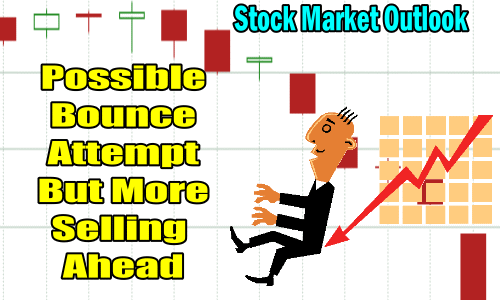
Therefore Tuesday should start with a bounce, give back the bounce and end the day lower again.
Stock Market Outlook Archives
Stock Market Outlook For Wed May 6 2026 – Choppy But Higher Still

Morning Investing Strategy Notes for Tue May 5 2026

Stock Market Outlook For Tue May 5 2026 – Overbought and Lower

Morning Investing Strategy Notes for Mon May 4 2026
Stock Market Outlook For Mon May 4 2026 – Dips Likely With Possible Lower Close

Morning Investing Strategy Notes for Fri May 1 2026
Stock Market Outlook For Fri May 1 2026 – Overbought But Higher

Morning Investing Strategy Notes for Thu Apr 30 2026
Stock Market Outlook For Thu Apr 30 2026 – Dips Likely Possible Lower Close
Morning Investing Strategy Notes for Wed Apr 29 2026
Stock Market Outlook For Wed Apr 29 2026 – Choppy But Higher Ahead Of More Earnings

Morning Investing Strategy Notes for Tue Apr 28 2026