
 Monday gave investors the bounce that was expected. The catalyst to the bounce was White House Adviser Peter Navarro indicating that reports of the US restricting Chinese companies from US stock markets was “fake news”. That bounced stocks higher. That, followed by an upgrade on Apple Stock by JP Morgan which boosted the outlook for the stock by 21% to $265, was enough to get buyers back in on Monday. The index broke through 2980 intraday but then closed back at the 2975 support level.
Stock Market Outlook Chart Comments At The Close on Mon Sep 30 2019
The 21 day moving average is continuing to climb which is bullish. The index on Monday closed at the 21 day moving average and left behind a bullish candlestick for Tuesday.
The 100 and 200 day moving averages are still climbing, as they continue to signal higher prices are ahead for stocks. The 50 day moving average is trending sideways which is bearish.
The S&P chart is somewhat bullish heading into Tuesday but so far, even Monday’s rally is only keeping the index in the same tight trading range.
The Lower Bollinger Band moved higher today and is at the 100 day. The Upper Bollinger Band is still falling. The index appears headed into a Bollinger Bands Squeeze. At the present time the squeeze looks more like it could end with a move lower. On Tuesday however, if we see the index close above the 21 day moving average, then the Bollinger Bands Squeeze is more likely going to end with a push above 3000.
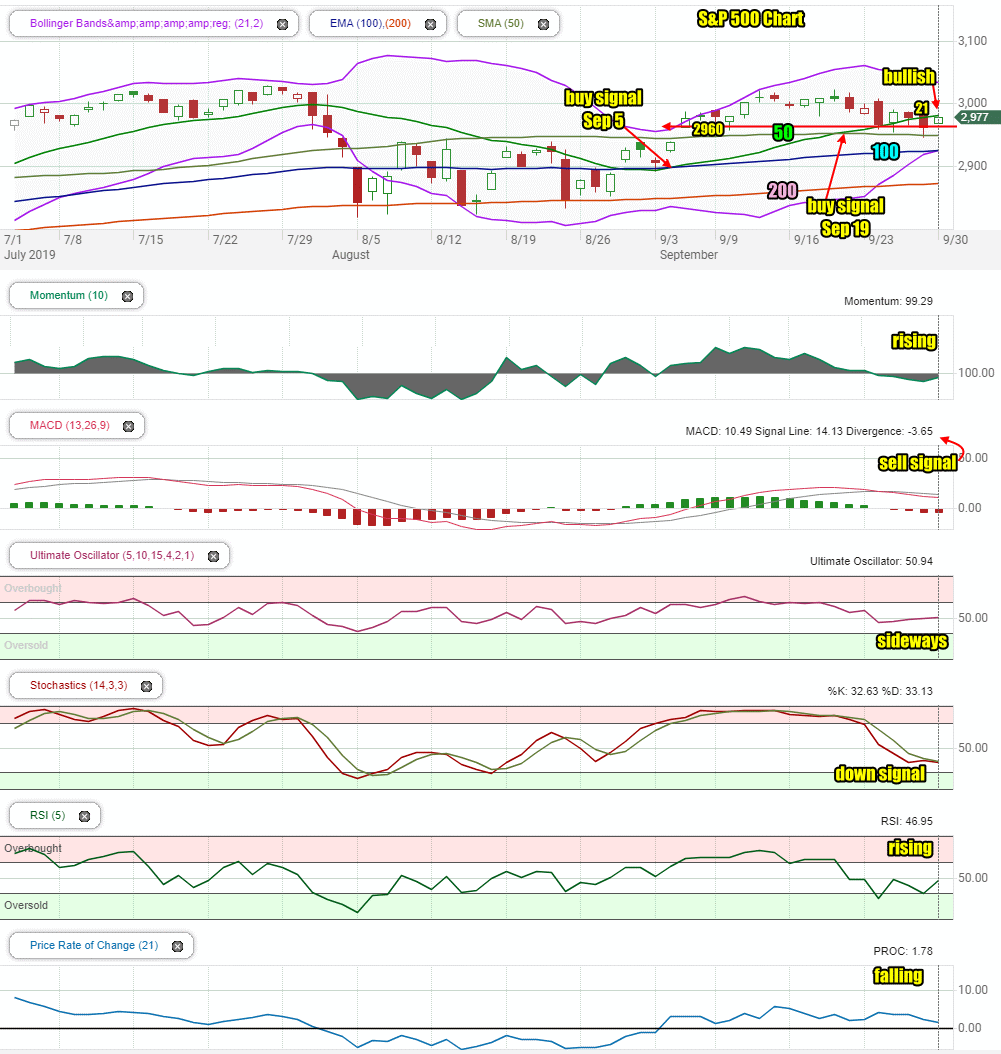
Stock Market Outlook review of Mon Sep 30 2019
Stock Market Outlook: Technical Indicators Review:
Momentum: Momentum is back rising and is only slightly negative.
- Settings: For momentum I use a 10 period when studying market direction.
MACD Histogram: MACD (Moving Averages Convergence / Divergence) issued down signal on Fri Sep 27 2019. The down signal was stronger on Monday.
- Settings: For MACD Histogram, I am using the Fast Points set at 13, Slow Points at 26 and Smoothing at 9.
Ultimate Oscillator: The Ultimate Oscillator signal is back positive but more sideways than up or down.
- Settings: The Ultimate Oscillator settings are: Period 1 is 5, Period 2 is 10, Period 3 is 15, Factor 1 is 4, Factor 2 is 2 and Factor 3 is 1. These are not the default settings but are the settings I use with the S&P 500 chart set for 1 to 3 months.
Slow Stochastic: The Slow Stochastic has a weak sell signal in place.
- Settings: For the Slow Stochastic I use the K period of 14 and D period of 3. The Slow Stochastic tries to predict the market direction further out than just one day.
Relative Strength Index: The RSI signal is rising sharply which could indicate a move higher is getting ready to occur.
- Settings: The relative strength index is set for a period of 5 which gives it 5 days of market movement to monitor. It is often the first indicator to show an overbought or oversold signal.
Rate of Change: The rate of change signal is falling which complicates the picture as the Rate Of Change is signaling lower prices are ahead.
- Settings: Rate Of Change is set for a 21 period. This indicator looks back 21 days and compares price action from the past to the present. With the Rate Of Change, prices are rising when signals are positive. Conversely, prices are falling when signals are negative. As an advance rises the Rate Of Change signal should also rise higher, otherwise the rally is suspect. A decline should see the Rate Of Change fall into negative signals. The more negative the signals the stronger the decline.
Support and Resistance Levels To Be Aware Of:
3000 is resistance
2960 is good support
2950 is light support
2900 is light support
2860 is light support
2840 is support
2800 is strong support
2795 is light support
2745 to 2750 is light support
2725 is light support
2700 is light support
2675 is light support
2650 is support
2625 is light support
2600 is support.
Stock Market Outlook for Tomorrow – Tue Oct 1 2019
For Tuesday we should see the index open higher and try to push to 2990 or 2995 before a dip takes place. The dip could be back to 2980 or 2975.
The technical indicators are still pointing to weakness but the Relative Strength Index (RSI) is rising sharply and often it is the first signal to indicate a change in trend. The biggest problem facing stocks at the moment is the torn emotions of investors who are being whipsawed by everything from impeachment news to fake news to trade war news. When news calms down the market rises. When news escalates to the “bad side”, stocks sell lower. It is a tough market to try to invest in but if you can get past all the news in general, you can clearly see that the S&P is still stuck in a trading range. Dips are still great entry points and rallies are profitable to sell out into. So while the index may seem “tough” to invest in, taking a moment out and looking just at the chart without all the media noise, you can see that the bulls remain in charge. They need a catalyst to move stocks higher such as good news on the trade war with China, or as we saw today, good news on stocks in general. For Tuesday the indexes will close higher but there are still dips ahead so this brings us back to the outlook of “Choppy, Dips Likely, But Higher”.
Stock Market Outlook Archives
Stock Market Outlook For Wed May 6 2026 – Choppy But Higher Still

Morning Investing Strategy Notes for Tue May 5 2026

Stock Market Outlook For Tue May 5 2026 – Overbought and Lower

Morning Investing Strategy Notes for Mon May 4 2026
Stock Market Outlook For Mon May 4 2026 – Dips Likely With Possible Lower Close

Morning Investing Strategy Notes for Fri May 1 2026
Stock Market Outlook For Fri May 1 2026 – Overbought But Higher

Morning Investing Strategy Notes for Thu Apr 30 2026
Stock Market Outlook For Thu Apr 30 2026 – Dips Likely Possible Lower Close
Morning Investing Strategy Notes for Wed Apr 29 2026
Stock Market Outlook For Wed Apr 29 2026 – Choppy But Higher Ahead Of More Earnings

Morning Investing Strategy Notes for Tue Apr 28 2026