

Monday saw the S&P open strongly but unable to recapture Friday’s opening high. That started some selling which lasted until into the lunch hour. An early afternoon rally managed to push above 4705 but buyers seemed reluctant in the over heated market to place fresh capital into stock. The index slipped into the close to end the day up 4.17 at 4701.70. This was a new 52 week closing high.
The NASDAQ followed the S&P throughout the day and ended up 10 points to 15982.36. During the day Monday the NASDAQ was above 16000 briefly but did not make a new intraday high. This was also a new 52 week closing high.
Let’s review the close on Monday to see what to expect for Tue Nov 9 2021
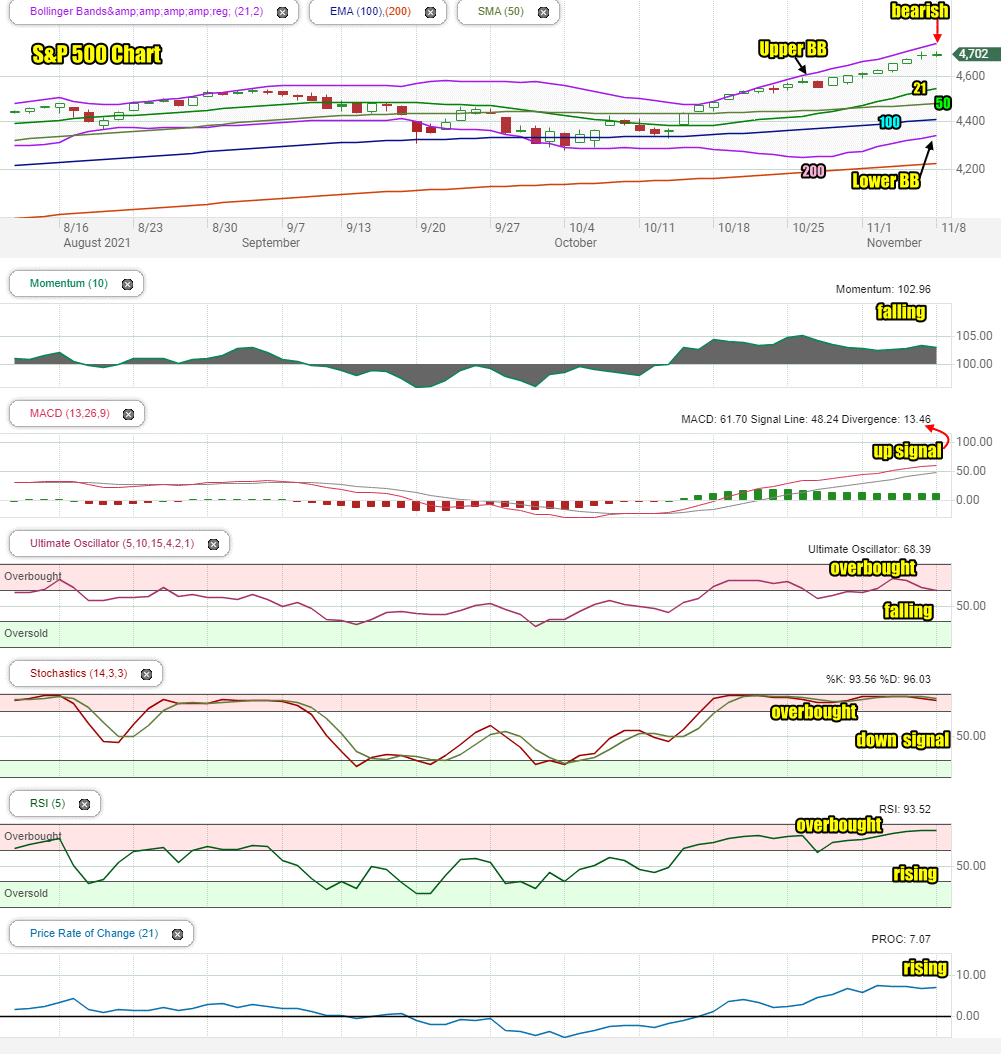
Stock Market Outlook Chart Comments At The Close on Mon Nov 8 2021
The index closed below the Upper Bollinger Band and left behind a second bearish candlestick for Tuesday. The candlestick indicates the market is overbought and needs to consdolidate.
The Upper Bollinger Band is still rising which is bullish. The Lower Bollinger Band is also rising. This is bearish.
The 21, 50, 100 and 200 day moving averages are all climbing. This is bullish.
For Tuesday the chart is dominantly bullish except for the Lower Bollinger Band and the closing candlestick.
Stock Market Outlook review of Mon Nov 8 2021
Stock Market Outlook: Technical Indicators Review:
Momentum: Momentum is falling slightly and positive.
- Settings: For momentum I use a 10 period when studying market direction.
MACD Histogram: MACD (Moving Averages Convergence / Divergence) issued an up signal on Wed Oct 13 2021 . On Monday the up signal lost a bit of strength.
- Settings: For MACD Histogram, I am using the Fast Points set at 13, Slow Points at 26 and Smoothing at 9.
Ultimate Oscillator: The Ultimate Oscillator is falling and overbought.
- Settings: The Ultimate Oscillator settings are: Period 1 is 5, Period 2 is 10, Period 3 is 15, Factor 1 is 4, Factor 2 is 2 and Factor 3 is 1. These are not the default settings but are the settings I use with the S&P 500 chart set for 1 to 3 months.
Slow Stochastic: The Slow Stochastic has a down signal in place and still very overbought..
Settings: For the Slow Stochastic I use the K period of 14 and D period of 3. The Slow Stochastic tries to predict the market direction further out than just one day.
Relative Strength Index: The RSI signal is rising and very overbought.
- Settings: The relative strength index is set for a period of 5 which gives it 5 days of market movement to monitor. It is often the first indicator to show an overbought or oversold signal.
Rate of Change: The rate of change signal is rising.
- Settings: Rate Of Change is set for a 21 period. This indicator looks back 21 days and compares price action from the past to the present. With the Rate Of Change, prices are rising when signals are positive. Conversely, prices are falling when signals are negative. As an advance rises the Rate Of Change signal should also rise higher, otherwise the rally is suspect. A decline should see the Rate Of Change fall into negative signals. The more negative the signals the stronger the decline.
Support and Resistance Levels To Be Aware Of:
4700 is resistance
4655 is resistance
4600 is resistance
4550 is light support
4525 is light support
4500 is support
4490 is support
4475 is support
4450 is support
4400 is support
4370 is light support
4350 is light support
4300 is light support
Stock Market Outlook for Tomorrow – Tue Nov 9 2021
For Tuesday the technical indicators are again mixed. None though are pointing to a big down move coming. Instead they are signaling overbought readings which means the market rally is slowing.
Once again on Tuesday there will be some dips during the day which could be lower than what we saw on Monday. That means dips to 4685 or even 4670 are possible. Deeper dips though won’t last long as buyers will jump in.
The problem is the still the index is ahead of itself having jumped quickly to 4600, then 4650 and 4670 and then 7000. It’s been a fast move but usually the market will want to retest some of the jumps for a bit of support.
For Tuesday then the outlook is still bullish with a chance for yet another positive close, but a better chance for a lower close by the end of the day.
Stock Market Outlook Archives
Stock Market Outlook For Wed May 6 2026 – Choppy But Higher Still

Morning Investing Strategy Notes for Tue May 5 2026

Stock Market Outlook For Tue May 5 2026 – Overbought and Lower

Morning Investing Strategy Notes for Mon May 4 2026
Stock Market Outlook For Mon May 4 2026 – Dips Likely With Possible Lower Close

Morning Investing Strategy Notes for Fri May 1 2026
Stock Market Outlook For Fri May 1 2026 – Overbought But Higher

Morning Investing Strategy Notes for Thu Apr 30 2026
Stock Market Outlook For Thu Apr 30 2026 – Dips Likely Possible Lower Close
Morning Investing Strategy Notes for Wed Apr 29 2026
Stock Market Outlook For Wed Apr 29 2026 – Choppy But Higher Ahead Of More Earnings

Morning Investing Strategy Notes for Tue Apr 28 2026