
Monday’s market saw surprisingly good volume on the day ahead of Tuesday’s Mid-Term Elections. Normally volumes are lower but as the day wore on and the markets over higher, volumes picked up.
By the end of the day the S&P had retaken 3800 to close at 3806 and the NASDAQ rose a modest 89 points to close at 10,564.
On Tuesday the focus is on the Mid-Term Elections but historically the market has been higher. The technical indicators, as you’ll see below are fairly mixed as of the close on Monday.
Let’s review the closing technical indicators from Monday to see what to expect for Tuesday Nov 8.
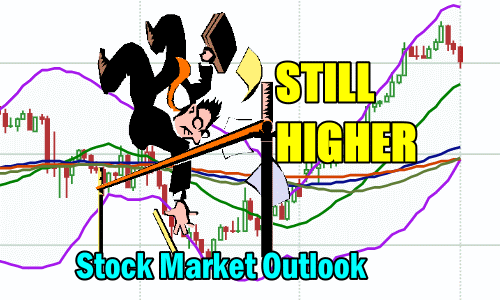
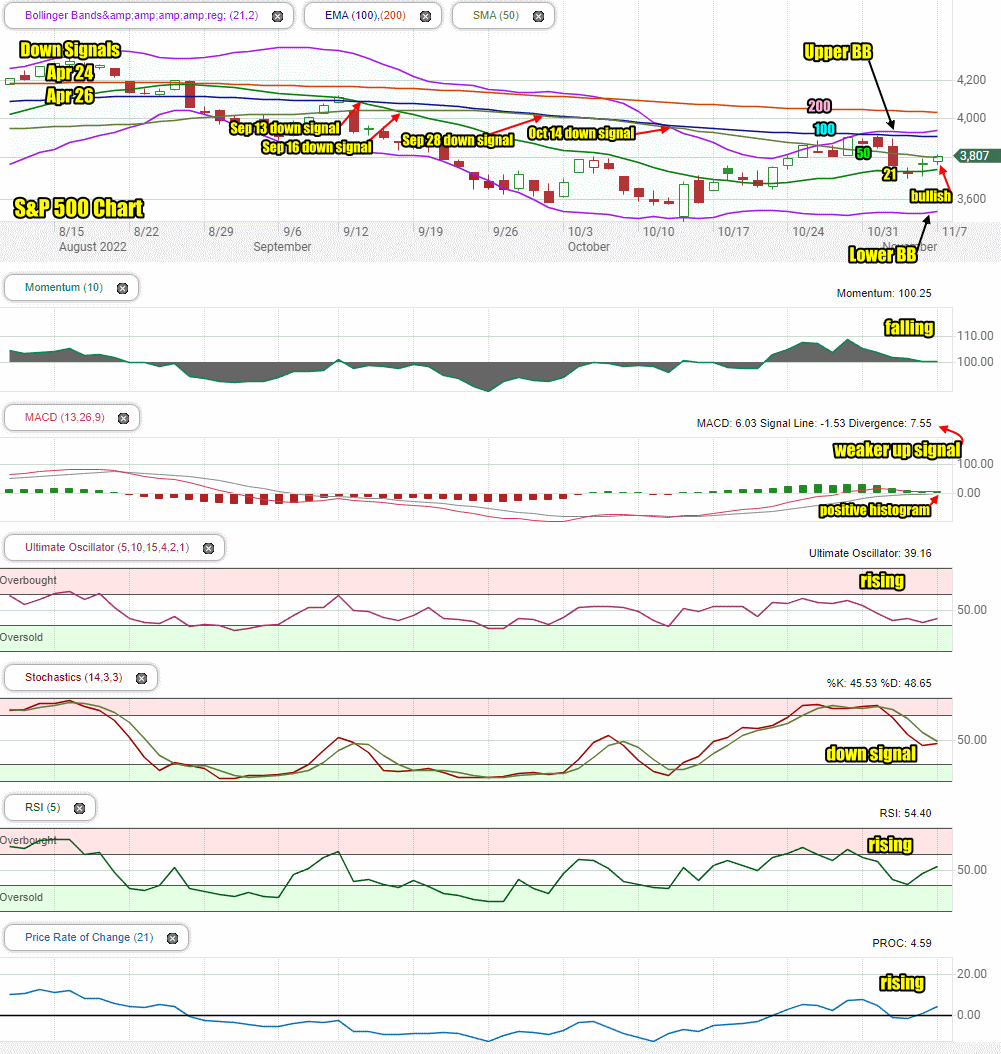
Stock Market Outlook Chart Comments At The Close on Mon Nov 7 2022
On Tuesday the S&P closing candlestick was back above the 21 day moving average and at one point had broken above the 50 day. The closing candlestick is bullish.
The Upper Bollinger Band has turned up and is still above all the major moving averages except the 200 day. This is bullish.
The Lower Bollinger Band is moving sideways but starting to turn up. Again this is bullish.
The 21 day moving average back rising which is bullish.
The 50, 100 and 200 day moving averages are still falling. This is bearish.
There are 7 down signals in place since April and no up signals.
The chart though is 55% bearish for Tuesday as there are enough bullish signals to point to a probable higher day.
Stock Market Outlook review of Mon Nov 7 2022
Stock Market Outlook: Technical Indicators Review:
Momentum: Momentum is falling and barely positive.
- Settings: For momentum I use a 10 period when studying market direction.
MACD Histogram: MACD (Moving Averages Convergence / Divergence) issued an up signal on Thursday Oct 16. On Friday the up signal lost more of the up signal. The histogram also lost more strength. Both though are still positive.
- Settings: For MACD Histogram, I am using the Fast Points set at 13, Slow Points at 26 and Smoothing at 9.
Ultimate Oscillator: The Ultimate Oscillator is rising.
- Settings: The Ultimate Oscillator settings are: Period 1 is 5, Period 2 is 10, Period 3 is 15, Factor 1 is 4, Factor 2 is 2 and Factor 3 is 1. These are not the default settings but are the settings I use with the S&P 500 chart set for 1 to 3 months.
Slow Stochastic: The Slow Stochastic has a weak down signal in place and could signal up intraday on Tuesday.
Settings: For the Slow Stochastic I use the K period of 14 and D period of 3. The Slow Stochastic tries to predict the market direction further out than just one day.
Relative Strength Index: The RSI signal however is rising and positive.
- Settings: The relative strength index is set for a period of 5 which gives it 5 days of market movement to monitor. It is often the first indicator to show an overbought or oversold signal.
Rate of Change: The rate of change signal is also rising and positive for a second day.
- Settings: Rate Of Change is set for a 21 period. This indicator looks back 21 days and compares price action from the past to the present. With the Rate Of Change, prices are rising when signals are positive. Conversely, prices are falling when signals are negative. As an advance rises the Rate Of Change signal should also rise higher, otherwise the rally is suspect. A decline should see the Rate Of Change fall into negative signals. The more negative the signals the stronger the decline.
Support and Resistance Levels To Be Aware Of:
4000 is resistance
3975 is resistance
3965 is resistance
3950 is resistance
3925 is resistance
3900 is resistance
3875 is resistance
3850 is resistance
3825 is resistance
3800 is resistance
3775 is light resistance
3750 is light resistance
3730 is light support
3700 is light support
3675 is light support
3650 is light support
Stock Market Outlook for Tomorrow – Nov 8 2022
Signals are still very mixed but the bullish signals are still enough to point to another higher day on Tuesday. Historically the day of the Mid-Term Elections has been positive 75% of the time since 1974. The day after the elections have historically been negative.
For Tuesday, watch for some weakness, probably in the morning but a higher close is still expected.
Potential Economic and Political Market Moving Events
Tuesday:
Mid-Term Elections
Thursday:
A number of inflation reports
Stock Market Outlook Archives
Stock Market Outlook For Wed May 6 2026 – Choppy But Higher Still

Morning Investing Strategy Notes for Tue May 5 2026

Stock Market Outlook For Tue May 5 2026 – Overbought and Lower

Morning Investing Strategy Notes for Mon May 4 2026
Stock Market Outlook For Mon May 4 2026 – Dips Likely With Possible Lower Close

Morning Investing Strategy Notes for Fri May 1 2026
Stock Market Outlook For Fri May 1 2026 – Overbought But Higher

Morning Investing Strategy Notes for Thu Apr 30 2026
Stock Market Outlook For Thu Apr 30 2026 – Dips Likely Possible Lower Close
Morning Investing Strategy Notes for Wed Apr 29 2026
Stock Market Outlook For Wed Apr 29 2026 – Choppy But Higher Ahead Of More Earnings

Morning Investing Strategy Notes for Tue Apr 28 2026