

Monday saw new intraday highs with the S&P reaching 4743 before the afternoon sell-off which sent the index back below 4700 to end the day at 4682, a loss of 15 points.
The NASDAQ also made a new intraday high of 16212 before selling off to end the day down 202 points for a 1.2% loss, ending at 15854.
The first two days of Thanksgiving week have a history of weakness. Wednesday and Friday though have a history of moving higher.
Let’s see what the closing technical indicators from Monday can tell us about Tuesday’s market.
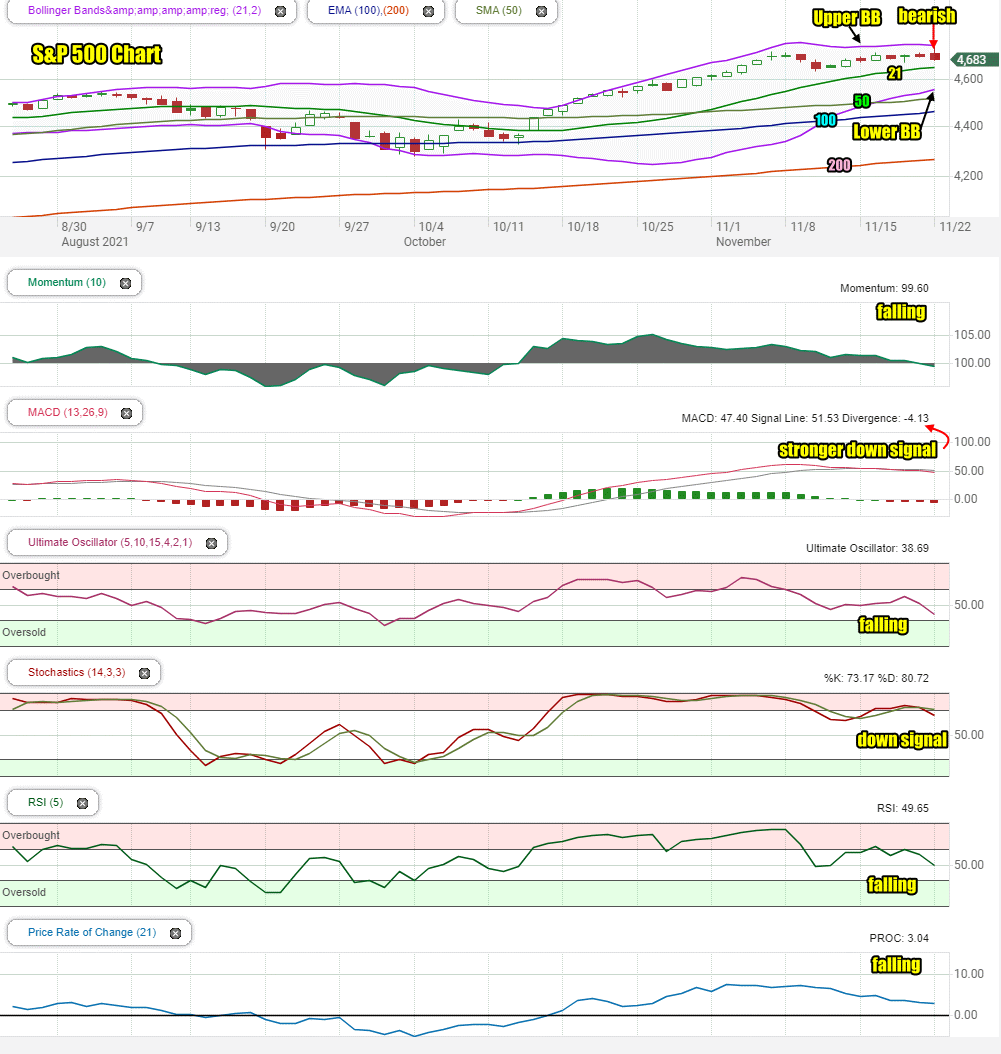
Stock Market Outlook Chart Comments At The Close on Mon Nov 22 2021
The close on Monday left behind a bearish candlestick for Tuesday.
The Lower Bollinger Band is still rising above the 50 day which is bearish. The Upper Bollinger Band is trending sideways which is bearish. The chance of a Bollinger Bands Squeeze is high for the fourth week of November,
The 21, 100 and 200 day moving averages are all climbing. This is bullish. The 50 day is back climbing as well, also bullish.
For Tuesday the chart is split almost equally between bearish and bullish signals but the closing candlestick is the biggest concern. It is signaling a morning bounce with further selling and a lower close.
Stock Market Outlook review of Mon Nov 22 2021
Stock Market Outlook: Technical Indicators Review:
Momentum: Momentum is falling and negative.
- Settings: For momentum I use a 10 period when studying market direction.
MACD Histogram: MACD (Moving Averages Convergence / Divergence) issued a down signal on Wed Nov 17 2021 . On Monday the down signal gained more strength.
- Settings: For MACD Histogram, I am using the Fast Points set at 13, Slow Points at 26 and Smoothing at 9.
Ultimate Oscillator: The Ultimate Oscillator is falling.
- Settings: The Ultimate Oscillator settings are: Period 1 is 5, Period 2 is 10, Period 3 is 15, Factor 1 is 4, Factor 2 is 2 and Factor 3 is 1. These are not the default settings but are the settings I use with the S&P 500 chart set for 1 to 3 months.
Slow Stochastic: The Slow Stochastic has a down signal for Tuesday.
Settings: For the Slow Stochastic I use the K period of 14 and D period of 3. The Slow Stochastic tries to predict the market direction further out than just one day.
Relative Strength Index: The RSI signal is falling.
- Settings: The relative strength index is set for a period of 5 which gives it 5 days of market movement to monitor. It is often the first indicator to show an overbought or oversold signal.
Rate of Change: The rate of change signal is falling.
- Settings: Rate Of Change is set for a 21 period. This indicator looks back 21 days and compares price action from the past to the present. With the Rate Of Change, prices are rising when signals are positive. Conversely, prices are falling when signals are negative. As an advance rises the Rate Of Change signal should also rise higher, otherwise the rally is suspect. A decline should see the Rate Of Change fall into negative signals. The more negative the signals the stronger the decline.
Support and Resistance Levels To Be Aware Of:
4700 is resistance
4655 is resistance
4600 is good support
4550 is light support
4525 is light support
4500 is support
4490 is support
4475 is support
4450 is support
4400 is support
4370 is light support
4350 is light support
4300 is light support
Stock Market Outlook for Tomorrow – Tue Nov 23 2021
For Tuesday the technical signals are all moving lower. Often when we see all the indicators pointing lower, investors should expect a bounce attempt and then a move lower to end the day.
Historically Monday and Tuesday of Thanksgiving week, have often been weaker. It is Wednesday and Friday when the market has staged a reversal.
For now though, Tuesday is continuing to look poor as the S&P has still been unable to hold above 4700 and build strength to push still higher.
Stock Market Outlook Archives
Stock Market Outlook For Wed May 6 2026 – Choppy But Higher Still

Morning Investing Strategy Notes for Tue May 5 2026

Stock Market Outlook For Tue May 5 2026 – Overbought and Lower

Morning Investing Strategy Notes for Mon May 4 2026
Stock Market Outlook For Mon May 4 2026 – Dips Likely With Possible Lower Close

Morning Investing Strategy Notes for Fri May 1 2026
Stock Market Outlook For Fri May 1 2026 – Overbought But Higher

Morning Investing Strategy Notes for Thu Apr 30 2026
Stock Market Outlook For Thu Apr 30 2026 – Dips Likely Possible Lower Close
Morning Investing Strategy Notes for Wed Apr 29 2026
Stock Market Outlook For Wed Apr 29 2026 – Choppy But Higher Ahead Of More Earnings

Morning Investing Strategy Notes for Tue Apr 28 2026