FullyInformed.com

Stock Market Outlook for Tue Nov 21 2017 – Weakness With Bias Up

Nov 20, 2017 | Stock Market Outlook

Stock Market Outlook - Weakness But Higher

What Happened On Mon Nov 20 2017:

Monday saw stocks open higher, turn sideways and then cling to positive territory but just barely.


Closing Statistics for Mon Nov 20 2017:

S&P 500 Index Close

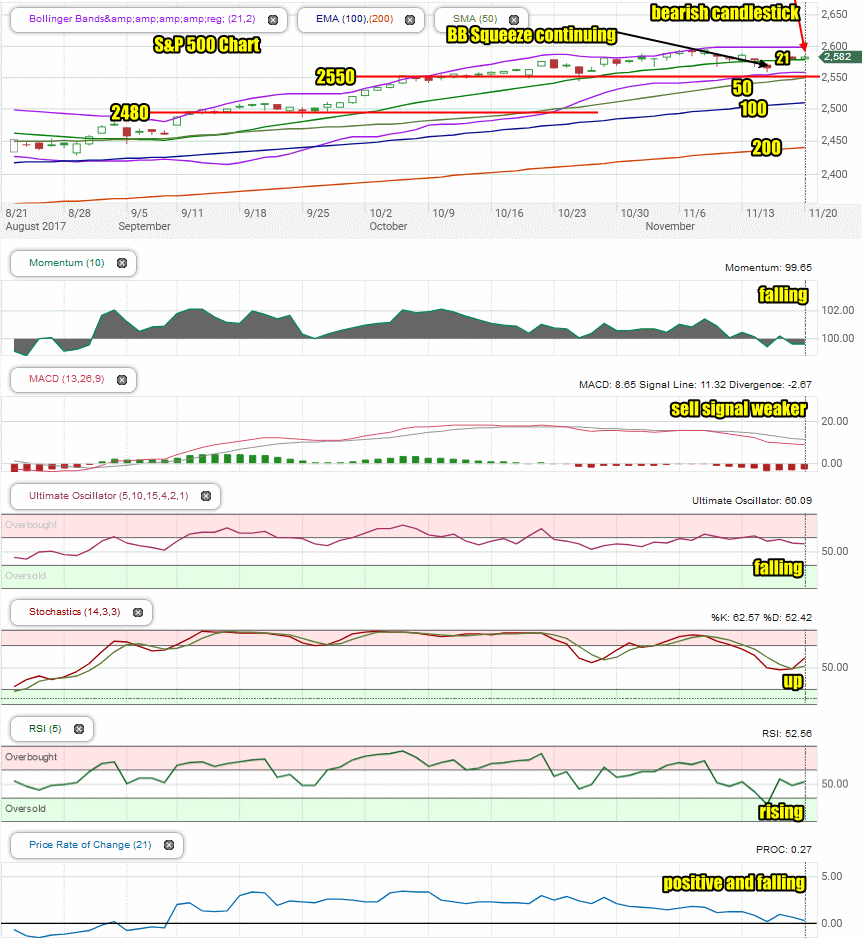
The S&P index ended up 3.29 to 2582.14

Dow Jones Index Close

The Dow Jones ended up 72.09 to 23,430.33

NASDAQ Index Close

The NASDAQ closed up 7.92 to 6790.71


Stock Market Outlook – Review of Mon Nov 20 2017

Stock Market Outlook for Tue Nov 21 2017

Chart Comments At The Close:

On Monday the S&P hardly changed as it drifted sideways closing up 3.29 points for a gain of 0.13%. The candlestick at the end of the day was bearish for Tuesday.

The index managed to stay above the 21 day moving average which is bullish.

The Bollinger Bands Squeeze is still continuing with no clear signals as to the direction stocks may move out of the squeeze.

All major moving averages are still climbing.

Stock Market Outlook: Technical Indicators:

Momentum: For momentum I use a 10 period when studying market direction. Momentum is falling and negative.

MACD Histogram: For MACD Histogram, I am using the Fast Points set at 13, Slow Points at 26 and Smoothing at 9. MACD (Moving Averages Convergence / Divergence) issued a sell signal on Oct 24. The sell signal is weaker again by the close on Monday.

Ultimate Oscillator: The Ultimate Oscillator settings are: Period 1 is 5, Period 2 is 10, Period 3 is 15, Factor 1 is 4, Factor 2 is 2 and Factor 3 is 1. These are not the default settings but are the settings I use with the S&P 500 chart set for 1 to 3 months. The Ultimate Oscillator signal continued to fall.

Slow Stochastic: For the Slow Stochastic I use the K period of 14 and D period of 3. The Slow Stochastic tries to predict the market direction further out than just one day. The Slow Stochastic issued an up signal at the close on Monday.

Relative Strength Index: The relative strength index is set for a period of 5 which gives it 5 days of market movement to monitor.  It often is the first indicator to show an overbought or oversold signal.  The RSI signal is rising for Tuesday.

Rate of Change: Rate Of Change is set for a 21 period. This indicator looks back 21 days and compares price action from the past to the present.  The rate of change signal is positive but falling for Tuesday.


Support Levels To Be Aware Of:

There is support at the 2550 level which could assist in pushing the index higher in November.

The S&P has light support at 2480. It also has light support at 2450 and good support at 2425. Below that there is some support at 2400, 2380, 2350. 2300 has the most support at present.


 Stock Market Outlook for Tomorrow – Tue Nov 21 2017

For Tue Nov 21 2017, the signals are still weak but there are a few changes. The Slow Stochastic moved from neutral to an up signal. The Relative Strength Index (RSI) also moved up. The signals are now split with 1 negative, 1 with a sell signal and 2 moving lower and 2 rising. Overall the index looks weak but the close on Tuesday could see the index end either way, up or down.

With this week being so short the chance of any sell-off is limited. Tuesday will probably end either flat on the day or slightly higher.


 Market Direction Internal Links

Profiting From Understanding Market Direction (Articles Index)

How I Use Market Timing

How I Use Market Timing

Understanding Short-Term Signals

Various Market Timing Systems

Market Direction Portfolio Trades (Members)

Market Direction External Links

Market Direction

IWM ETF Russell 2000 Fund Info

Market Direction SPY ETF 500 Fund Info


Search

Select to view all results...

Generic selectors
Exact matches only
Search in title
Search in content
Post Type Selectors

Recent Outlooks

Stock Market Outlook for Thu Apr 25 2024 – Weakness and Lower

Prior Trading Day Summary: Wednesday saw the rally stall. With the rally stalling investors took profits which weighed on stocks. The close saw the SPX up just 1 point at 5071 and the NASDAQ higher by 16 points to 15,712 …

Morning Investing Strategy Notes for Wed Apr 24 2024

For FullyInformed Members the morning Investing Strategy Notes for Wed Apr 24 2024 discuss the second bounce on Tuesday and the outlook for the remainder of the week. There are a large number of trades outlined for today. These include …

Stock Market Outlook for Wed Apr 24 2024 – Some Weakness But Higher Close

Prior Trading Day Summary: Tuesday saw the rally continue for a second day with rising up volume, wider market breadth and a higher gain. All of this is bullish. Much of the credit came from the PMI numbers which were …

Morning Investing Strategy Notes for Tue Apr 23 2024

For FullyInformed Members the morning Investing Strategy Notes for Tue Apr 23 2024 discuss the bounce on Monday. There are trade ideas on a wide number of stocks including Nucor Stock (NUE), General Electric Stock (GE), United Parcel Service Stock …

Stock Market Outlook for Tue Apr 23 2024 – Bounce But Lower

Prior Trading Day Summary: Monday saw the long awaited bounce from the recent selling and market breadth was bullish. The SPX rose 43 points recovering all of Friday’s loss to close back above 5000 at 5010. The NASDAQ jumped 169 …

Morning Investing Strategy Notes for Mon Apr 22 2024

For FullyInformed Members the morning Investing Strategy Notes for Mon Apr 22 2024 discuss the outlook for the start of the fourth week of April. There are also comments on repairing positions using AMD and ARM as examples. There are …

Stock Market Outlook for Mon Apr 22 2024 – No Change – Deeply Oversold Bounce Possible

Prior Trading Day Summary: Friday saw stocks open flat and try to climb within the first 15 minutes. When that failed the selling continued. The early afternoon saw a rally attempt once the SPX fell below 5000 but the bounce …

Morning Investing Strategy Notes for Fri Apr 19 2024

For FullyInformed Members the morning Investing Strategy Notes for Fri Apr 19 2024 discuss the outlook for for a potential bounce that ends the day with the indexes positive. There are comments and trade ideas on Netflix Stock (NFLX), American …

Stock Market Outlook for Fri Apr 19 2024 – Deeply Oversold – Bounce Likely – Higher Close

Prior Trading Day Summary: Thursday saw another morning bounce attempt but no follow through. However the SPX did not break below 5000 and managed to close at 5011 although minutes before the close it was 5020 which would have turned …

Morning Investing Strategy Notes for Thu Apr 18 2024

For FullyInformed Members the morning Investing Strategy Notes for Thu Apr 18 2024 discuss the outlook for Thursday and a possible bounce or a move lower. There are trade ideas outlined in Netflix Stock (NFLX), American Express Company Stock (AXP) …

Stock Market Outlook for Thu Apr 18 2024 – Deeply Oversold – Bounce Attempt Expected

Prior Trading Day Summary: Wednesday saw a bounce attempt at the open which managed to reach 5078 before selling once again pushed stocks lower. By 12:45 stocks looks almost ready to break below 5000 but managed to find buyers who …

Morning Investing Strategy Notes for Wed Apr 17 2024

For FullyInformed Members the morning Investing Strategy Notes for Wed Apr 17 2024 discuss the outlook for a potential bounce on Wednesday. There are trade ideas outlined in Las Vegas Sands Stock (LVS), Alcoa Stock (AA), Discover Financial Stock (DFS) …

Stock Market Outlook for Wed Apr 17 2024 – Another Bounce Attempt

Prior Trading Day Summary: Tuesday found stocks stuck in a fairly tight trading range as investors remain worried about a potential Israeli retaliatory strike against Iran and what might be the implications. For much of the day the SPX trading …

Morning Investing Strategy Notes for Tue Apr 16 2024

For FullyInformed Members the morning Investing Strategy Notes for Tue Apr 16 2024 discuss the outlook for stocks for Tuesday and the chance of a bounce. There are trade ideas outlined in United Airlines Holdings Stock (UAL), Interactive Brokers (IBKR) …