

Prior Trading Day Summary:
On Monday stocks opened lower as expected following the Moody’s credit downgrade. By 11:40 the SPX was at a new intraday high. For the rest of the day stocks turned sideways as investors prepared for Tuesday’s CPI numbers.
The SPX lost 3 points at 4411, on very low volume of 3.4 billion shares traded.
The NASDAQ lost 30 points to close at 13,767 on 4.4 billion shares traded.
Let’s review the closing technical indicators from Mon Nov 13 2023 to see what to expect for Tue Nov 14 2023.
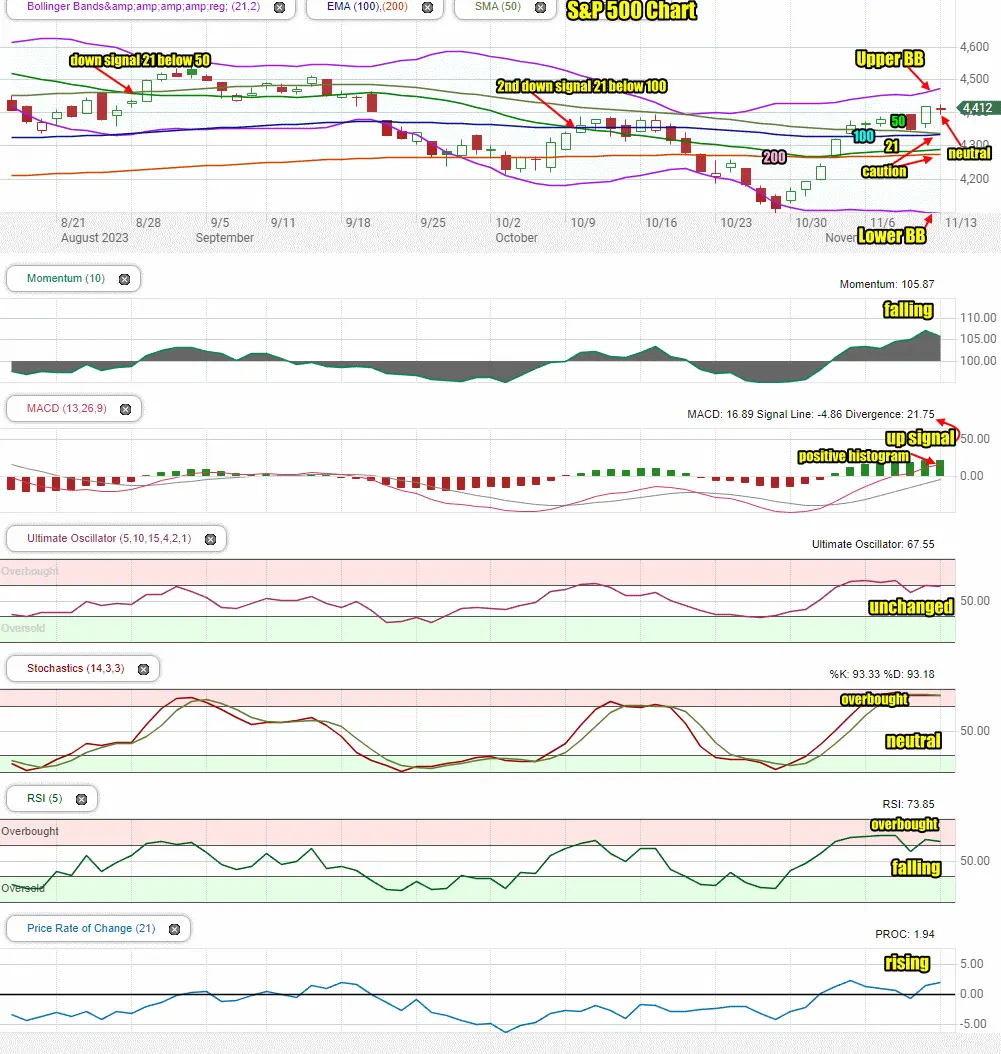
Stock Market Outlook: SPX Closing Chart For Mon Nov 13 2023
The index closed above all major moving averages which is bullish.
The closing candlestick ended the day above 4400 which is bullish and with a neutral signal for Tuesday.
The 21 day moving average continued to climb away from the 200 day although it remains cautionary. The 50 day moving average however ended almost at the 100 day. If it falls below it, it will be another down signal. Presently this signal is cautionary.
The Lower Bollinger Band is moving lower which is bullish. The Upper Bollinger Band is turning higher which is also bullish.
The S&P chart is still bearish but there are a number of bullish signs heading into the CPI reports on Tuesday.
Stock Market Outlook review of Mon Nov 13 2023
Stock Market Outlook: Technical Indicators Review
Momentum: Momentum is falling and positive.
|
MACD Histogram: MACD (Moving Averages Convergence / Divergence) issued an up signal on Thu Nov 2. On Mon Nov 13 2023 the close saw a strong up signal.
|
Ultimate Oscillator: The Ultimate Oscillator is unchanged and positive. It is nearing overbought.
|
Slow Stochastic: The Slow Stochastic has a neutral signal in place and is overbought.
|
Relative Strength Index: The RSI signal is unchanged and positive. It is signaling overbought.
|
Rate of Change: The rate of change signal is rising and positive. It is signaling tomorrow will have a large move, up or down.
|
Stock Market Outlook: Support and Resistance Levels |
| 4490 is resistance |
| 4475 is resistance |
| 4450 is resistance |
| 4440 is resistance |
| 4425 is resistance |
| 4410 is resistance |
| 4400 is resistance |
| 4390 is resistance |
| 4375 is support |
| 4350 is support |
| 4325 is support |
| 4300 is support |
| 4275 is light support |
| 4250 is light support |
| 4235 is light support |
| 4225 is support |
| 4200 is good support |
| 4185 is support |
| 4175 is support |
| 4150 is good support |
Stock Market Outlook for Tue Nov 14 2023
The technical indicators turned more neutral by the close on Monday rather than positive or negative. The overall bias though remains bullish.
Tuesday’s market will be controlled by the CPI numbers due out at 8:30. The Consumer Price Index will tell investors whether the high rates are indeed having an impact on prices in a variety of areas of the economy, or whether they are continuing to rise.
The consensus is that for the month of October they are expected a 0.1% rise versus the prior month’s 0.4%. Core CPI is expected to remain unchanged while CPI year-over-year is expected to decline to 3.3%.
If the CPI numbers are higher than the consensus the market risks a sell-off. If the number come in at or lower than consensus, expect stocks to shoot higher. If the numbers are higher than the consensus many analysts and investors believe interest rates will rise further. That too will be a drag on stocks.
Potential Economic and Political Market Moving Events
This week the main economic events that can impact markets are on Tuesday with the Consumer Price Index, Wednesday with the Producer Price Index, Thursday is Home builder confidence index and Friday is Housing starts and building permits.
Monday:
2:00 Monthly US federal budget expect at -$70 billion.
Tuesday:
8:30 Consumer Price Index is expected to be just 0.1% for October.
8:30 Core CPI is expected to be unchanged at 0.3%
8:30 CPI year-over-year is expected at 3.3% which is lower than Sept’s 3.7%
8:30 Core CPI year-over-year is expected to be unchanged at 4.1%
A miss to the downside will be positive for stocks. A miss to the upside will be negative for stocks.