
 Prior Trading Day Summary
On Monday news of a resolution to the ongoing government shutdown sent stocks soaring.
The S&P rose 103 points to close at 6832. Volume of 5.5 billion shares saw 62% of all trades advancing. 66% of all stocks were rising.
The NASDAQ also rallied rising 533 points for the second biggest single day rally of the year. The NASDAQ closed at 23,527 with 65% of all stocks rising.
With the strong rally on Monday is there a chance for a follow through on Tuesday?
Let’s review the closing technical indicators from Mon Nov 10 2025 to see if there is an answer for Tue Nov 11 2025.
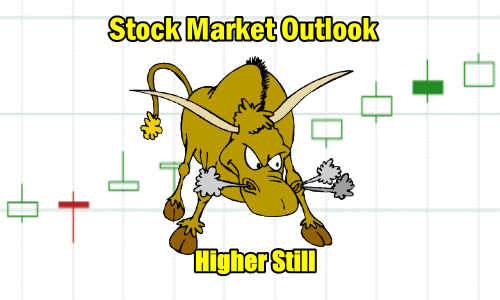
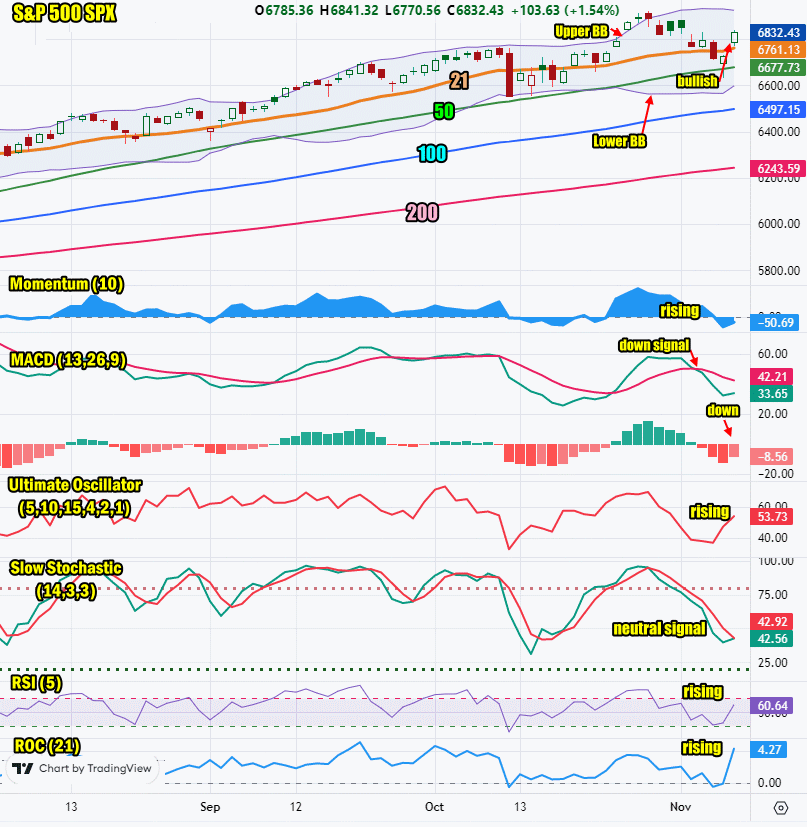
Stock Market Outlook: SPX Closing Chart For Mon Nov 10 2025
The index closed above all major moving averages which is bullish despite being below the Upper Bollinger Band.
The closing candlestick is bullish for Tuesday but with a shadow indicating a chance for a dip on Tuesday but a higher close is still expected.
The 21 day moving average is rising and closed at 6761 which is bullish.
The 50 day moving average is rising and closed at 6677 which is bullish.
The 100 day moving average is rising and closed at 6497 which is bullish.
The 200 day moving average is rising and closed at 6243 which is bullish.
The Lower Bollinger Band is below the 50 day moving average and rising which is bullish. The Upper Bollinger Band is falling which is bearish at present.
The SPX chart has more bullish than bearish signals for Tuesday.
SPX Stock Market Outlook review of Mon Nov 10 2025
Stock Market Outlook: Technical Indicators Review
Momentum: Momentum is rising and negative.
|
MACD Histogram: MACD (Moving Averages Convergence / Divergence) issued a down signal on Wed Nov 5. On Mon Nov 10 2025 the down signal was weaker.
|
Ultimate Oscillator: The Ultimate Oscillator is rising.
|
Slow Stochastic: The Slow Stochastic has a neutral signal, a change from the down signal at Monday’s open.
|
Relative Strength Index: The RSI signal is rising.
|
| Rate of Change: The rate of change is rising, signaling Tuesday will end higher. Settings: Rate Of Change is set for a 21 period. This indicator looks back 21 days and compares price action from the past to the present. With the Rate Of Change, prices are rising when signals are positive. Conversely, prices are falling when signals are negative. As an advance rises, the Rate Of Change signal should also rise higher, otherwise the rally is suspect. A decline should see the Rate Of Change fall into negative signals. The more negative the signals the stronger the decline. |
Stock Market Outlook: Support and Resistance Levels |
| 6900 is resistance |
| 6875 is resistance |
| 6850 is resistance |
| 6800 is resistance |
| 6775 is resistance |
| 6750 is resistance |
| 6715 is resistance |
| 6700 is resistance |
| 6675 is resistance |
| 6650 is resistance |
| 6625 is resistance |
| 6600 is support |
| 6590 is support |
| 6570 is support |
| 6550 is support |
| 6500 is support |
| 6450 is support |
| 6425 is support |
| 6400 is support |
Stock Market Outlook for Tue Nov 11 2025
For Tue Nov 11 2025 the technical signals are changing to being bullish. Even the MACD down signal lost strength on Monday in the rally.
Tuesday is Veterans Day and the bond market is closed. That is often bullish for stocks.
For Tuesday there are some signs of a probable dip, perhaps in the morning to start the day off, but the close will be higher still.
Potential Economic and Political Market Moving Events
Monday:
No reports to be released
Tuesday:
6:00 NFIB optimism index is expected to slip to 98.2 from 98.8