
Monday’s recovery from the opening drop to the 2800 level was surprisingly strong, especially in the mid afternoon and into the close.
With investors worried about the airline sector thanks to Buffett announcing he had dumped all shares in that sector along with worries about an escalation of tensions with China, the afternoon saw them change their focus back to the reopening of businesses. That gave the market a lift and investors once again bought back into shares closing near the high of the day. By the end of the day the NASDAQ index was just 11% from its all-time high. Considering the dire warnings from analysts and economists, investors appear to be ignoring concerns and continue to pick up stocks on dips and push them higher. Let’s look at the close on Monday to see what it can tell us about Tuesday.
Stock Market Outlook Chart Comments At The Close on Mon May 4 2020
The SPX chart continues to be bearish with 6 sell signals in the chart. On Monday the index closed below the 200 and 100 day moving averages but above the 21 day. The 21 day moving average is continuing to climb higher and is above the 50 day issuing the first up signal in the chart.
The 200 day moving average is still leading the market, which is typical in a bear market. It is still followed closely by the 100 day. The 50 day is continuing to fall rapidly.
The closing candlestick on Monday is bullish for Tuesday.
The Upper Bollinger Band is continuing to rise and the Upper Bollinger Band is falling as the SPX nears another Bollinger Bands Squeeze.

Stock Market Outlook review of Mon May 4 2020
Stock Market Outlook: Technical Indicators Review:
Momentum: Momentum is rising and back positive.
- Settings: For momentum I use a 10 period when studying market direction.
MACD Histogram: MACD (Moving Averages Convergence / Divergence) issued an up signal on Thursday March 26. The up signal was a lot weaker on Monday and is down to single digits but still holding an up signal.
- Settings: For MACD Histogram, I am using the Fast Points set at 13, Slow Points at 26 and Smoothing at 9.
Ultimate Oscillator: The Ultimate Oscillator signal is rising and negative.
- Settings: The Ultimate Oscillator settings are: Period 1 is 5, Period 2 is 10, Period 3 is 15, Factor 1 is 4, Factor 2 is 2 and Factor 3 is 1. These are not the default settings but are the settings I use with the S&P 500 chart set for 1 to 3 months.
Slow Stochastic: The Slow Stochastic has a strong down signal in place.
Settings: For the Slow Stochastic I use the K period of 14 and D period of 3. The Slow Stochastic tries to predict the market direction further out than just one day.
Relative Strength Index: The RSI signal is rising.
- Settings: The relative strength index is set for a period of 5 which gives it 5 days of market movement to monitor. It is often the first indicator to show an overbought or oversold signal.
Rate of Change: The rate of change signal is slipping back which signals prices are not expect to climb by much.
- Settings: Rate Of Change is set for a 21 period. This indicator looks back 21 days and compares price action from the past to the present. With the Rate Of Change, prices are rising when signals are positive. Conversely, prices are falling when signals are negative. As an advance rises the Rate Of Change signal should also rise higher, otherwise the rally is suspect. A decline should see the Rate Of Change fall into negative signals. The more negative the signals the stronger the decline.
Support and Resistance Levels To Be Aware Of:
2900 is resistance
2860 is light support
2840 is light support
2800 is good support
2725 is light support
2700 is light support and marked a drop of 20.4%.
2675 is light resistant
2650 is light support
2625 is light support
2600 is support
2550 is light support
2500 was good support and marked a correction of 26.3%
2344 is the next level of support and marks a 30.9% correction.
2191 was the market low on March 23 and most analysts believe this is the low point we will see.
2100 is light support
2000 is good support and marks a drop of 1393 points for a 41% correction. Some analysts believe the index will fall this low before the bear market ends.
Stock Market Outlook for Tomorrow – Tue May 5 2020
For Tuesday May 5 the technical indicators are a bit more mixed but while there are signals pointing back to up, most are still weak and there are still strong signals to the downside.
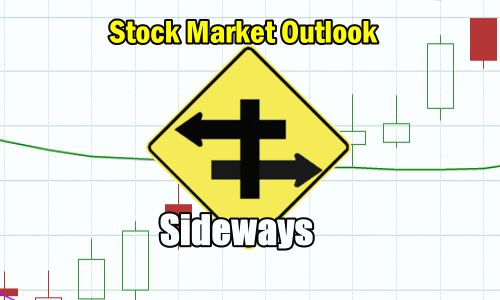
Tuesday looks to be a sideways day despite what the futures show. The Bollinger Bands Squeeze that is forming up looks like it could try to push stocks higher later this week.
For Tuesday then the outlook is sideways with continued weakness, just remember though there is still a bias to the upside although only a few technical indicators are advising us to expect a higher day.
Stock Market Outlook Archives
Stock Market Outlook For Wed May 6 2026 – Choppy But Higher Still

Morning Investing Strategy Notes for Tue May 5 2026

Stock Market Outlook For Tue May 5 2026 – Overbought and Lower

Morning Investing Strategy Notes for Mon May 4 2026
Stock Market Outlook For Mon May 4 2026 – Dips Likely With Possible Lower Close

Morning Investing Strategy Notes for Fri May 1 2026
Stock Market Outlook For Fri May 1 2026 – Overbought But Higher

Morning Investing Strategy Notes for Thu Apr 30 2026
Stock Market Outlook For Thu Apr 30 2026 – Dips Likely Possible Lower Close
Morning Investing Strategy Notes for Wed Apr 29 2026
Stock Market Outlook For Wed Apr 29 2026 – Choppy But Higher Ahead Of More Earnings

Morning Investing Strategy Notes for Tue Apr 28 2026