

On Friday the indexes closed higher on expectations of a debt ceiling deal being reached over the weekend.
The S&P gained 54 points and ended the day at 4205, the highest close since August 2022. Volume though was low at 3.7 billion shares traded.
The NASDAQ gain 227 points to end the day at 12,975, also the highest close since August 2022. Volume was just 4.4 billion shares traded.
Over the weekend a deal was struck for the debt ceiling. Despite complaints from various groups on what was in and what was out of the debt ceiling, the chance it is not passed is slim.
Let’s review the SPX closing technical indicators on Fri May 26 to see what to expect if stocks will rally higher on Tuesday.
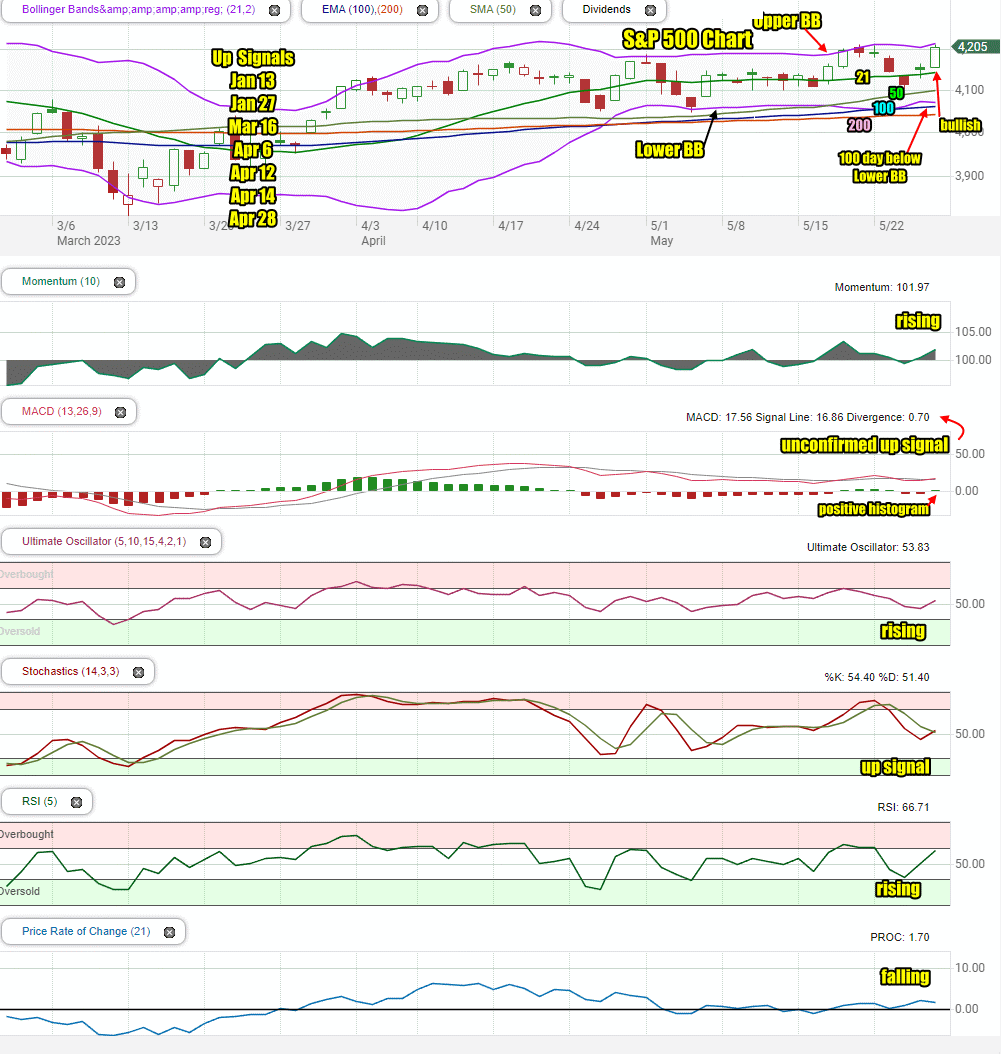
Stock Market Outlook Chart Comments At The Close on Fri May 26 2023
The index closed with a bullish candlestick for Tuesday with the close pushing the Upper Bollinger Band.
The SPX continues above the 21 day moving average.
The 100 day moving average has fallen below the Lower Bollinger Band which is bearish.
The 50 and 100 day moving averages are rising which is bullish.
The S&P chart is more bullish than bearish for Tuesday.
There are 7 up signal since January and no down signal in the chart.
Stock Market Outlook review of Fri May 26 2023
Stock Market Outlook: Technical Indicators Review:
Momentum: Momentum is rising and positive.
- Settings: For momentum I use a 10 period when studying market direction.
MACD Histogram: MACD (Moving Averages Convergence / Divergence) issued an unconfirmed up signal on Friday. The MACD histogram is positive.
- Settings: For MACD Histogram, I am using the Fast Points set at 13, Slow Points at 26 and Smoothing at 9.
Ultimate Oscillator: The Ultimate Oscillator is rising and positive.
- Settings: The Ultimate Oscillator settings are: Period 1 is 5, Period 2 is 10, Period 3 is 15, Factor 1 is 4, Factor 2 is 2 and Factor 3 is 1. These are not the default settings but are the settings I use with the S&P 500 chart set for 1 to 3 months.
Slow Stochastic: The Slow Stochastic has n up signal in place.
- Settings: For the Slow Stochastic I use the K period of 14 and D period of 3. The Slow Stochastic tries to predict the market direction further out than just one day.
Relative Strength Index: The RSI signal is rising sharply and positive. It is nearing overbought.
- Settings: The relative strength index is set for a period of 5 which gives it 5 days of market movement to monitor. It is often the first indicator to show an overbought or oversold signal.
Rate of Change: The rate of change signal is falling but positive.
- Settings: Rate Of Change is set for a 21 period. This indicator looks back 21 days and compares price action from the past to the present. With the Rate Of Change, prices are rising when signals are positive. Conversely, prices are falling when signals are negative. As an advance rises the Rate Of Change signal should also rise higher, otherwise the rally is suspect. A decline should see the Rate Of Change fall into negative signals. The more negative the signals the stronger the decline.
Support and Resistance Levels To Be Aware Of:
4250 is resistance
4240 is resistance
4225 is resistance
4210 is resistance
4200 is resistance
4190 is resistance
4180 is resistance
4175 is resistance
4150 is resistance
4135 is resistance
4125 is support
4100 is support
4090 is support
4075 is support
4050 is support
4030 is light support
4025 is light support
4000 is support
Stock Market Outlook for Tue May 30 2023
For Tuesday the technical signals are more mixed than we have seen for much of last week, but their overall bias is still higher. We will see some weakness, but stocks will bounce from any dips to close still higher.
On Friday MACD issued another unconfirmed up signal and the histogram turned back to positive. This will have a positive impact for Tuesday.
For Tuesday the technical indicators are advising a higher close is ahead. The Rate Of Change is advising that the up move on Tuesday will not be large but will be positive.
Potential Economic and Political Market Moving Events
The debt ceiling will dominate for much of this week but despite negative comments and those who say they will not vote for the “deal”, there is little chance this will not be passed.
On Tuesday there is nothing of significance that will impact stocks.
Tuesday:
9:00 Case-Shiller home price index
10:00 Consumer confidence