
The S&P on Monday set a new correction low, reaching 4062 which sparked an oversold rally in the final hour and a half of trading. It closed up 23 points to end the day at 4155.
The NASDAQ ended the day up 201 points to 12,536 after being lower intraday at 12213.
The Market Breadth Indicators though showed no change with signals still pointing lower despite the late after bounce.
Let’s review the closing technical indicators from Monday for the S&P to see what we should expect for Tue May 3 2022.
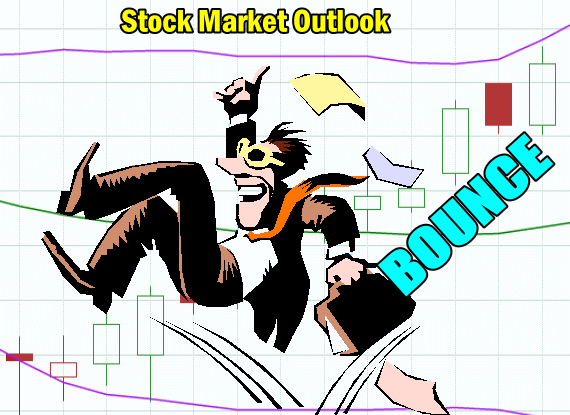
Stock Market Outlook Chart Comments At The Close on Fri Apr 29 2022
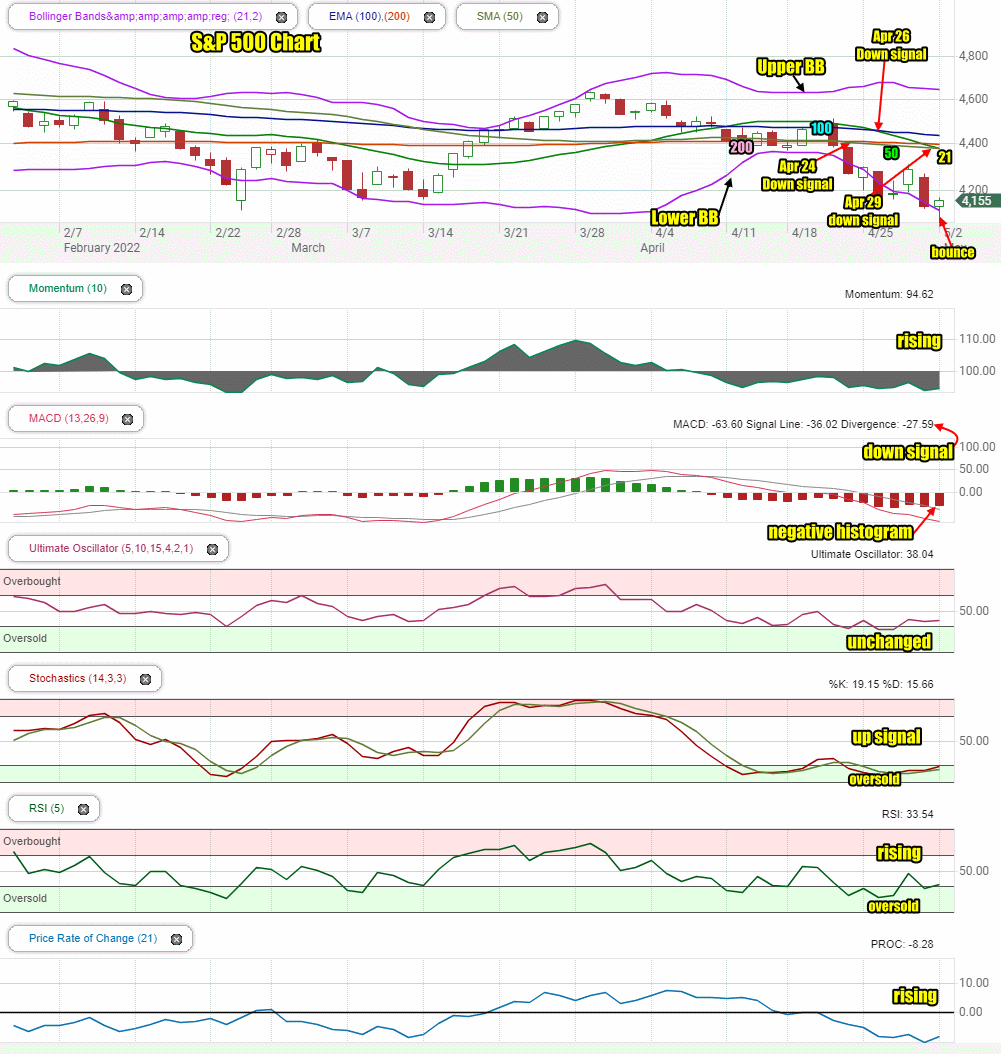
On Monday the closing candlestick is signaling a bounce is underway which should stretch at least into the morning on Tuesday off a new correction low on Monday.
On Monday another new down signal was issued as the 21 day fell below the 50 day.
There are no up signals in the SPX at present. The moving averages are all bearish.
The Upper Bollinger Band is trending sideways while the Lower Bollinger Band is continuing to fall. This is bearish.
With all the moving averages falling, the chart is pretty well 100% bearish. That’s why a bounce is likely to continue for at least part of Tuesday if not the whole day. Some of the bounce is also the result of investors believing that once the Fed announces a half point rate increase on Wednesday, they think the market will move higher with another “unknown” out of the way.
Stock Market Outlook review of Mon May 2 2022
Stock Market Outlook: Technical Indicators Review:
Momentum: Momentum is rising and negative.
- Settings: For momentum I use a 10 period when studying market direction.
MACD Histogram: MACD (Moving Averages Convergence / Divergence) issued a down signal Friday April 8. On Monday the down signal was still very strong. The histogram also is very bearish.
- Settings: For MACD Histogram, I am using the Fast Points set at 13, Slow Points at 26 and Smoothing at 9.
Ultimate Oscillator: The Ultimate Oscillator is unchanged,
- Settings: The Ultimate Oscillator settings are: Period 1 is 5, Period 2 is 10, Period 3 is 15, Factor 1 is 4, Factor 2 is 2 and Factor 3 is 1. These are not the default settings but are the settings I use with the S&P 500 chart set for 1 to 3 months.
Slow Stochastic: The Slow Stochastic has a stronger up signal in place and is signaling oversold.
Settings: For the Slow Stochastic I use the K period of 14 and D period of 3. The Slow Stochastic tries to predict the market direction further out than just one day.
Relative Strength Index: The RSI signal is rising as it leaves oversold readings.
- Settings: The relative strength index is set for a period of 5 which gives it 5 days of market movement to monitor. It is often the first indicator to show an overbought or oversold signal.
Rate of Change: The rate of change signal is also rising.
- Settings: Rate Of Change is set for a 21 period. This indicator looks back 21 days and compares price action from the past to the present. With the Rate Of Change, prices are rising when signals are positive. Conversely, prices are falling when signals are negative. As an advance rises the Rate Of Change signal should also rise higher, otherwise the rally is suspect. A decline should see the Rate Of Change fall into negative signals. The more negative the signals the stronger the decline.
Support and Resistance Levels To Be Aware Of:
4550 is light resistance
4525 is light resistance
4500 is resistance
4490 is light resistance
4475 is light resistance
4450 is light resistance
4400 is resistance
4370 is light support
4350 is light resistance
4300 is light resistance
4290 is light resistance
4270 is light resistance
4250 was good support
4225 was light support
4200 is good support
4150 is good support
4100 is light support
4050 is light support
4025 is light support
4000 is good support
Stock Market Outlook for Tomorrow – Tue May 3 2022
The market tumbling to a new low on Monday was enough to once again bring in buyers. On Tuesday, at least in the morning, the index should move higher. I will be buying SPY calls shortly after the open if the index moves higher to start the day.
For the present the dip on Monday down to 4062 could be enough to spark a rally into the Fed’s interest rate announcement on Wednesday and then into the April unemployment report.
On Tuesday we get job openings and quits, Factory orders and motor vehicles sales. These could help bounce the market higher.
Potential Market Moving Events
Tuesday:
10:00 Job opening and quits
10:00 Factory orders
no set time: Motor vehicle sales
Wednesday:
8:15: ADP employment report
2:00 FOMC statement
2:30 Fed Chair news conference
Thursday:
8:30 Initial jobless claims and continuing jobless claims
8:30 Productivity and Unit Labor Costs (should give further evidence on inflation’s impact)
Friday:
8:30 April nonfarm payrolls and unemployment rate
8:30 Average hourly earnings (another inflation indicator)
8:30 Labor force participation rate
Stock Market Outlook Archives
Stock Market Outlook For Wed May 6 2026 – Choppy But Higher Still

Morning Investing Strategy Notes for Tue May 5 2026

Stock Market Outlook For Tue May 5 2026 – Overbought and Lower

Morning Investing Strategy Notes for Mon May 4 2026
Stock Market Outlook For Mon May 4 2026 – Dips Likely With Possible Lower Close

Morning Investing Strategy Notes for Fri May 1 2026
Stock Market Outlook For Fri May 1 2026 – Overbought But Higher

Morning Investing Strategy Notes for Thu Apr 30 2026
Stock Market Outlook For Thu Apr 30 2026 – Dips Likely Possible Lower Close
Morning Investing Strategy Notes for Wed Apr 29 2026
Stock Market Outlook For Wed Apr 29 2026 – Choppy But Higher Ahead Of More Earnings

Morning Investing Strategy Notes for Tue Apr 28 2026