

Stock Market Summary for Fri May 25 2018
Friday saw slight losses on the the S&P and Dow but for the week all 3 indexes were higher with the NASDAQ up a full 1%.
Closing Statistics from Thu May 24 2018
The S&P fell 6.43 to 2721.33
The NASDAQ Composite rose 9.42 to 7433.85
The Dow Jones Industrial Average fell 58.67 to 24,753.09
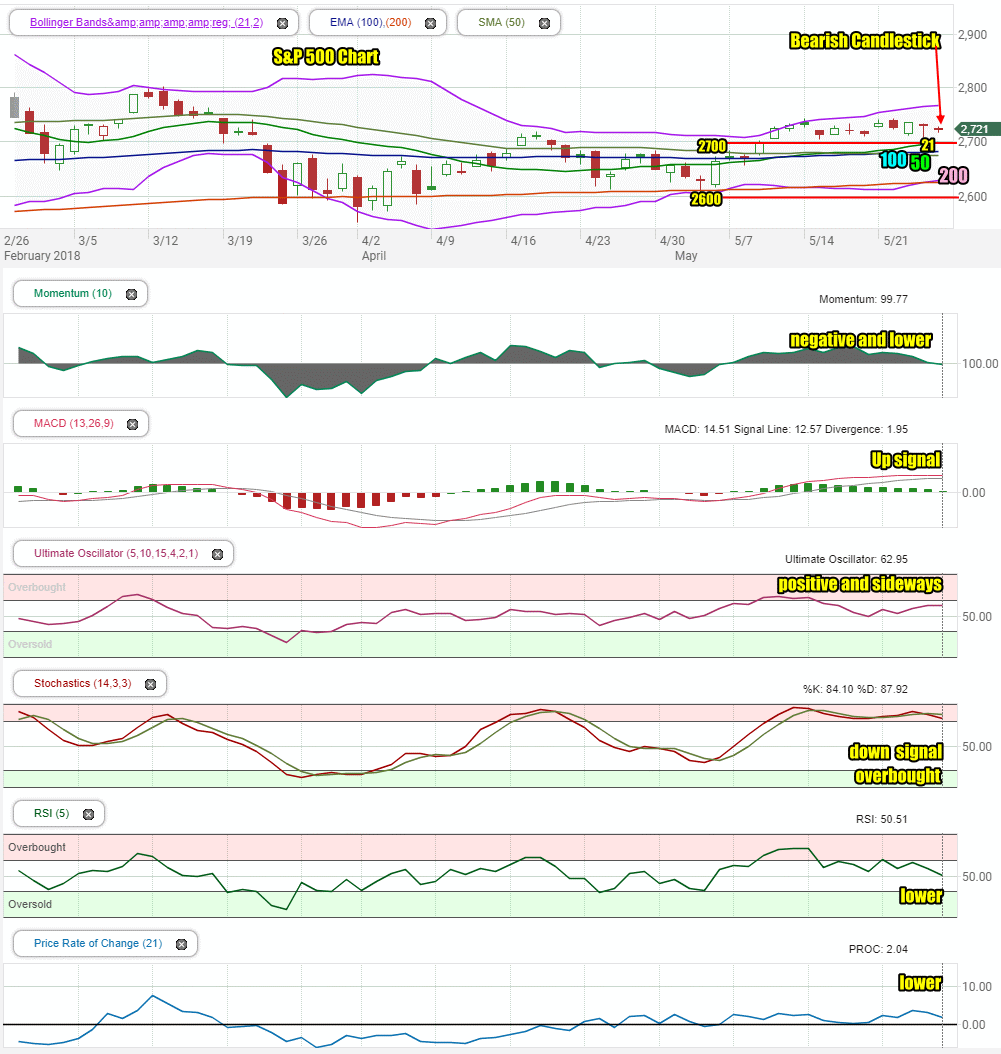
Stock Market Outlook Chart Comments At The Close on Thu May 24 2018
The S&P closed slightly lower again on Friday but is above 2700 and and above the 21 day and all other major moving averages.
The 21 day moving average continued above all major moving averages which is bullish.
The 200 day moving average is still climbing. Overall the chart continues to look bullish although the closing candlestick on Friday was bearish for the start of the week.
Stock Market Outlook review May 25 2018
Stock Market Outlook: Technical Indicators Review:
Momentum: For momentum I use a 10 period when studying market direction. Momentum is negative and moving lower.
MACD Histogram: For MACD Histogram, I am using the Fast Points set at 13, Slow Points at 26 and Smoothing at 9.MACD (Moving Averages Convergence / Divergence) issued an up signal on May 7. The up signal was weaker on Friday.
Ultimate Oscillator: The Ultimate Oscillator settings are: Period 1 is 5, Period 2 is 10, Period 3 is 15, Factor 1 is 4, Factor 2 is 2 and Factor 3 is 1. These are not the default settings but are the settings I use with the S&P 500 chart set for 1 to 3 months. The Ultimate Oscillator signal is positive and moving sideways.
Slow Stochastic: For the Slow Stochastic I use the K period of 14 and D period of 3. The Slow Stochastic tries to predict the market direction further out than just one day. The Slow Stochastic has a down signal in place and is overbought.
Relative Strength Index: The relative strength index is set for a period of 5 which gives it 5 days of market movement to monitor. It is often the first indicator to show an overbought or oversold signal. The RSI signal is moving lower.
Rate of Change: Rate Of Change is set for a 21 period. This indicator looks back 21 days and compares price action from the past to the present. With the Rate Of Change, prices are rising when signals are positive. Conversely, prices are falling when signals are negative. As an advance rises the Rate Of Change signal should also rise higher, otherwise the rally is suspect. A decline should see the Rate Of Change fall into negative signals. The more negative the signals the stronger the decline. The rate of change signal is moving slower but still positive.
Support Levels To Be Aware Of:
2745 to 2750 was light support
2725 is light support.
2700 is support.
2675 is light support.
2650 is light support
2620 is light support
2600 is strong support.
There is good support at the 2550 level from where the market bounced back from the recent correction low on Feb 9.
The S&P has light support at 2480. It also has light support at 2450 and good support at 2425. Below that there is some support at 2400, 2380, 2350. 2300 has the most support at present but would represent a full correction as a drop to this level would be 20% and just 5% away from a potential bear market signal.
Stock Market Outlook for Tomorrow – Tue May 29 2018
There are a number of geopolitical events that are driving investor sentiment at present all of which is negative for stocks. Considering how negative the mood is, stock indexes are actually holding up well. Last week the S&P stayed above 2700. This week we should see the index try to push higher. However there are bound to be dips along the way. Tuesday, after the long weekend, should be positive but again, events with North Korea and/or China would keep markets weaker on Tuesday.
Overall then, Tuesday will see weakness but we should also see some buying and we could see a positive close by the end of the day.
Stock Market Outlook Archives
Stock Market Outlook For Wed May 6 2026 – Choppy But Higher Still

Morning Investing Strategy Notes for Tue May 5 2026

Stock Market Outlook For Tue May 5 2026 – Overbought and Lower

Morning Investing Strategy Notes for Mon May 4 2026
Stock Market Outlook For Mon May 4 2026 – Dips Likely With Possible Lower Close

Morning Investing Strategy Notes for Fri May 1 2026
Stock Market Outlook For Fri May 1 2026 – Overbought But Higher

Morning Investing Strategy Notes for Thu Apr 30 2026
Stock Market Outlook For Thu Apr 30 2026 – Dips Likely Possible Lower Close
Morning Investing Strategy Notes for Wed Apr 29 2026
Stock Market Outlook For Wed Apr 29 2026 – Choppy But Higher Ahead Of More Earnings

Morning Investing Strategy Notes for Tue Apr 28 2026