
 Prior Trading Day Summary:
On Fri May 24 2024 The S&P recovered all of Thursday’s sell-off to end the day up 37 points to close at 5304. The NASDAQ rose 184 points, recovering almost 3 times what was lost on Thursday’s sell-off. The index closed at 16,920.
For the week the S&P closed virtually unchanged from the prior Friday’s close. The NASDAQ however, rose 235 points thanks in large part to earnings in NVIDIA (NVDA) which sent the stock higher, dragging much of the NASDAQ index along with it.
With the third week of May done, the focus now shifts to the fourth and final week of May 2024.
Let review the closing technical signals from Fri May 24 2024 to see how the start of the day after Memorial Day holiday will end up.
Stock Market Outlook: SPX Closing Chart For Fri May 24 2024
The index closed above the 21 day moving average and the 50 day. It is still primarily moving sideways.
The closing candlestick is bullish for Tuesday.
The 21 day moving average is still climbing above the 50 day continuing the latest up signal.
The 50 day moving average is climbing which is bullish.
The 200 day moving average is still climbing. The 200 day is at 4831 which is bullish and the 100 day is also climbing to 5043.
The Lower Bollinger Band is below the 100 day moving average and rising which is bullish. The Upper Bollinger Band is turning higher. This is also bullish.
The S&P chart is bullish for the start of the final week of May.
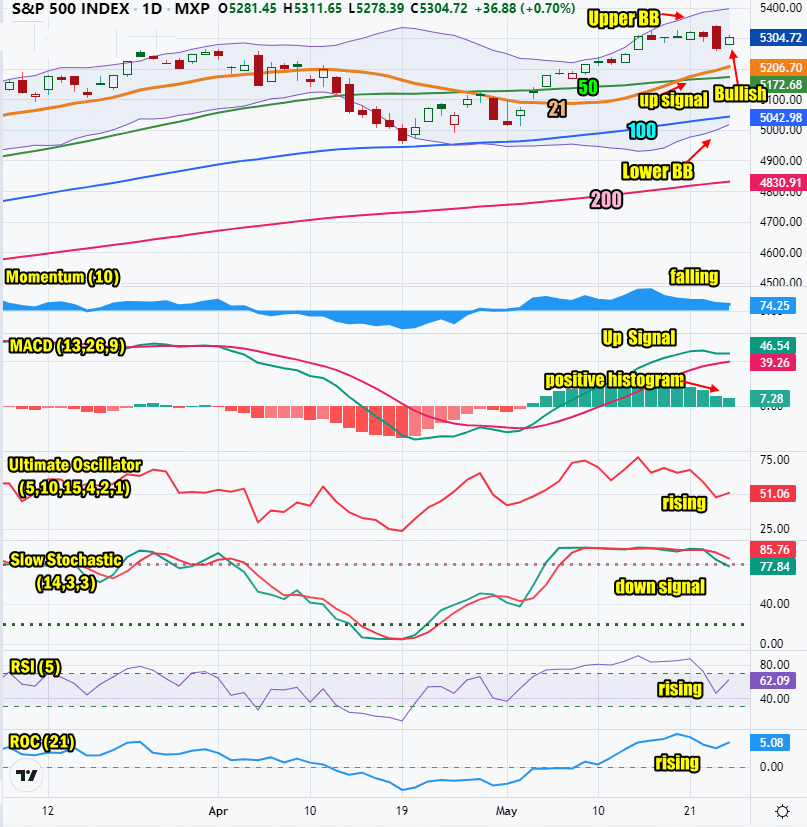
SPX Stock Market Outlook review of Fri May 24 2024 – chart courtesy TradingView
Stock Market Outlook: Technical Indicators Review
Momentum: Momentum is falling and positive.
|
MACD Histogram: MACD (Moving Averages Convergence / Divergence) issued an up signal on Fri May 3. The up signal lost some strength on Fri May 24 2024 despite the rally.
|
Ultimate Oscillator: The Ultimate Oscillator is rising and not overbought.
|
Slow Stochastic: The Slow Stochastic has a down signal in place.
|
Relative Strength Index: The RSI signal is rising and positive.
|
Rate of Change: The rate of change signal is rising signaling the Tuesday will close higher.
|
Stock Market Outlook: Support and Resistance Levels |
| 5325 is resistance |
| 5310 is resistance |
| 5300 is resistance |
| 5275 is resistance |
| 5250 is resistance |
| 5225 is resistance |
| 5200 is resistance |
| 5190 is light support |
| 5175 is light support |
| 5150 is support |
| 5125 is support |
| 5115 is support |
| 5100 is support |
| 5075 is support |
| 5050 is support |
| 5025 is support |
| 5000 is light support |
Stock Market Outlook for Tue May 28 2024
The technical indicators for Tuesday are positive and bullish. The day is set to end higher but it could be a choppy day as investors return following the Memorial Day Holiday. Historically the day after Memorial Day has been bullish 83% of the time since myrecords since 1974.
Potential Economic and Political Market Moving Events
On Wednesday the Fed’s Beige Book is released. That can cause some volatility. Friday we get the latest PCE numbers. Those numbers could swing the markets.
Monday:
Memorial Day
Tuesday:
9:00 Case-Shiller home price index is expected to be unchanged at 7.3%
10:00 Consumer Confidence is expect to slip to 96.0 from 97.0 prior