

Prior Trading Day Summary:
On Monday stocks opened with a deep dip thanks to Moody’s downgrade to the US credit rating. However as expected, investors snapped up stocks in the dip and by the close, the index had recovered call the losses and closed slightly higher.
The SPX was up 5 points to close at 5963. Volume was 4.2 billion with 51% of all volume being traded lower.
The NASDAQ rose 4 points to close at 19215. Volume was 11.2 billion, slightly more trades than we saw on Friday. While 63% of all volume traded on the NASDAQ was rising, 47% of all stocks were falling.
The rally back from the opening plunge was impressive but also continues to show the rally as overbought and in need of a consolidation of gains made.
Let’s review the technical indicators from the close on Mon May 19 2025 to see what we should expect for Tue May 20 2025.
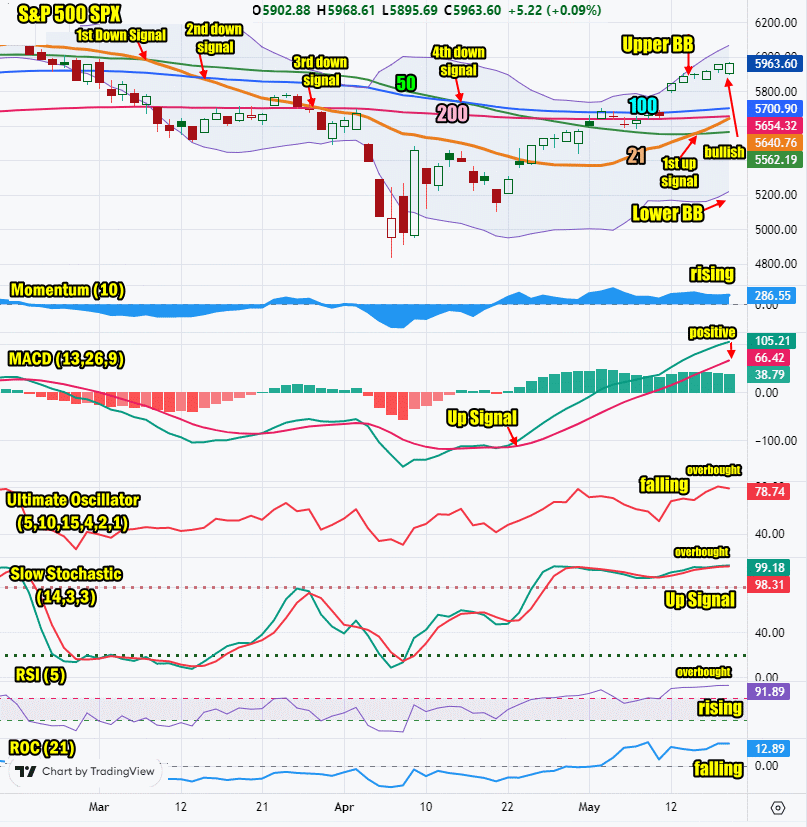
Stock Market Outlook: SPX Closing Chart For Mon May 19 2025
The index closed above all major moving averages and below the Upper Bollinger Band. This signals overbought. The index is once again back drifting sideways.
The closing candlestick is bullish but signaling overbought.
The 21 day moving average is rising and closed at 5640 which is bullish. On Wednesday the 21 day crossed above the 50 day, the first up signal from the 21 day moving average. This reversed the 5th down signal in the SPX chart. It is not moving above the 200 day which is another up signal.
The 50 day moving average is rising and closed at 5562 which is bullish. The 50 day moving average fell below the 100 day on Tue April 15 which issued a 4th down signal on the SPX.
The 100 day moving average is rising and closed at 5700 which is bullish.
The 200 day moving average is rising and closed at 5654 which is bullish.
The Lower Bollinger Band is turning higher which is bullish. The Upper Bollinger Band is rising which is bullish.
For Tue May 20 2025 the SPX chart is more bullish than bearish with continuing warnings of overbought dips likely.
SPX Stock Market Outlook review of Mon May 19 2025
Stock Market Outlook: Technical Indicators Review
Momentum: Momentum is rising and positive.
|
MACD Histogram: MACD (Moving Averages Convergence / Divergence) issued an up signal on Tue Apr 22 2025. On Mon May 19 2025 the up signal lost some strength.
|
Ultimate Oscillator: The Ultimate Oscillator is falling and overbought.
|
Slow Stochastic: The Slow Stochastic has an up signal at the close and is overbought.
|
Relative Strength Index: The RSI signal is rising and overbought.
|
| Rate of Change: The rate of change signal is falling, signaling a lower close is expected on Tuesday. Settings: Rate Of Change is set for a 21 period. This indicator looks back 21 days and compares price action from the past to the present. With the Rate Of Change, prices are rising when signals are positive. Conversely, prices are falling when signals are negative. As an advance rises, the Rate Of Change signal should also rise higher, otherwise the rally is suspect. A decline should see the Rate Of Change fall into negative signals. The more negative the signals the stronger the decline. |
Stock Market Outlook: Support and Resistance Levels |
| 6000 is resistance |
| 5990 is resistance |
| 5975 is resistance |
| 5950 is resistance |
| 5925 is resistance |
| 5900 is resistance |
| 5850 is resistance |
| 5800 is resistance |
| 5785 is resistance |
| 5750 is support |
| 5700 is support |
| 5650 is support |
| 5630 is support |
| 5600 is support |
| 5550 is support |
| 5500 is support |
| 5475 is support |
| 5450 is support |
| 5400 is support |
Stock Market Outlook for Tue May 20 2025
For Tuesday, the day starts with earnings from Home Depot (HD). If they miss estimates and fail to beat last year’s earnings for the same quarter, the market will likely dip lower. If the forward guidance is lowered by Home Depot management, stocks will also move lower.
The technical indicators are also showing the index as overbought and there are some signs of weakness once more creeping into stocks. There is a chance for a lower close on Tuesday but dips are a definite possibility. Deeper dips are worth trading while shallow dips are not.
For Tuesday I expect weakness unless Home Depot (HD) blows away earnings estimates, which I think is unlikely. The day will be choppy and the close has a chance to be lower on Tuesday.
Potential Economic and Political Market Moving Events
Monday:
10:00 Leading economic indicators dipped more than estimated to -1.0% from -0.8% prior
Tuesday:
No econo0mic reports