

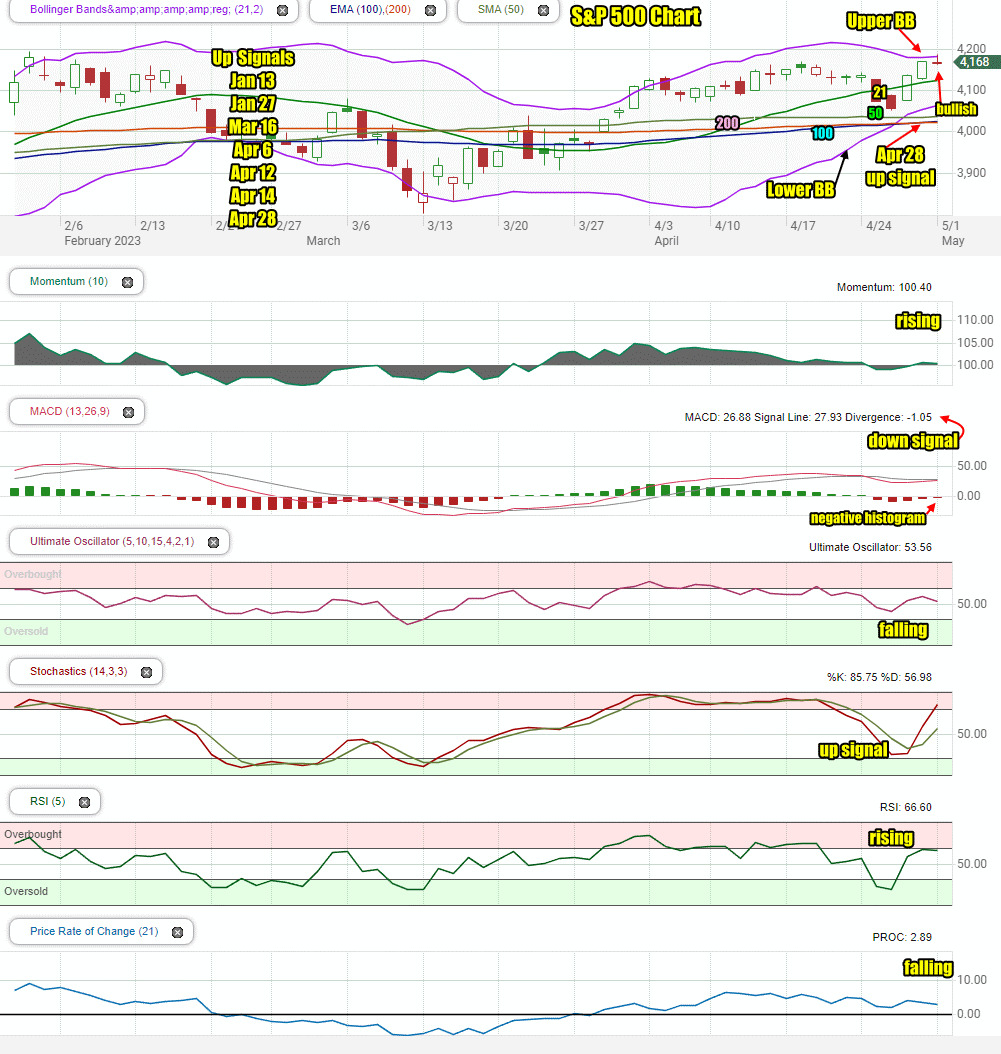
On Monday investors tested the 4180 level for resistance and while the index eventually ended back at 4167, the 4180 looks strong enough for the bulls to push beyond it. The problem right now is the Fed’s decision on interest rates which is due out on Wednesday afternoon. Investors are unwilling to commit to the market until that decision is known. By the end of the day the index was back where it had closed on Friday. One thing that was noticeable was the continued rise of the 100 day moving average above the 200 day. This is a bullish signal.
Let’s review the closing technical indicators from Mon May 1 2023 to see what we should expect for the second trading day of May.
Stock Market Outlook Chart Comments At The Close on Mon May 1 2023
The index closed with a bullish candlestick for Tuesday. It is also a typical candlestick before a weak day of dips. The SPX closed above all major moving averages and reached the Upper Bollinger Band. The Bollinger Bands Squeeze is in full swing and now looks set to move the S&P higher.
On Friday the 100 day moving average finally moved above the 200 day which sets the index back into a bullish stance and wipes out the last remaining down signal which stretched all the way back to April 24 2022. On Monday the move higher continues for the 100 day.
The S&P chart is bullish for Tuesday although dips should be expected and could be deeper than anticipated.
There are 7 up signal since January and no down signal in the chart.
Stock Market Outlook review of Mon May 1 2023
Stock Market Outlook: Technical Indicators Review:
Momentum: Momentum is rising and positive.
- Settings: For momentum I use a 10 period when studying market direction.
MACD Histogram: MACD (Moving Averages Convergence / Divergence) issued a down signal on Tue Apr 25 2023. That down signal was almost gone by the close on Monday.
- Settings: For MACD Histogram, I am using the Fast Points set at 13, Slow Points at 26 and Smoothing at 9.
Ultimate Oscillator: The Ultimate Oscillator is falling and positive.
- Settings: The Ultimate Oscillator settings are: Period 1 is 5, Period 2 is 10, Period 3 is 15, Factor 1 is 4, Factor 2 is 2 and Factor 3 is 1. These are not the default settings but are the settings I use with the S&P 500 chart set for 1 to 3 months.
Slow Stochastic: The Slow Stochastic has an up signal in place and rising sharply.
- Settings: For the Slow Stochastic I use the K period of 14 and D period of 3. The Slow Stochastic tries to predict the market direction further out than just one day.
Relative Strength Index: The RSI signal is rising, positive and nearing overbought.
- Settings: The relative strength index is set for a period of 5 which gives it 5 days of market movement to monitor. It is often the first indicator to show an overbought or oversold signal.
Rate of Change: The rate of change signal is falling and positive.
- Settings: Rate Of Change is set for a 21 period. This indicator looks back 21 days and compares price action from the past to the present. With the Rate Of Change, prices are rising when signals are positive. Conversely, prices are falling when signals are negative. As an advance rises the Rate Of Change signal should also rise higher, otherwise the rally is suspect. A decline should see the Rate Of Change fall into negative signals. The more negative the signals the stronger the decline.
Support and Resistance Levels To Be Aware Of:
4250 is resistance
4240 is resistance
4225 is resistance
4210 is resistance
4200 is resistance
4190 is resistance
4180 is resistance
4175 is resistance
4150 is resistance
4135 is resistance
4125 is support
4100 is support
4090 is support
4075 is support
4050 is support
4030 is light support
4025 is light support
4000 is support
Stock Market Outlook for Tue May 2 2023
For Tuesday the technical indicators are unchanged from Monday. For much of the day we should expect sideways action as we get the Fed’s decision on interest rates on Wednesday and that might keep stocks in check today. Overall though, investors are bullish that the Fed may pause rates or signal that a pause is likely after one more rate hike.
May is that month termed, “Sell in May and Go Away” which is based on historical returns which show the months of May to October tend to be the worse 6 months for stock market returns. That may well end up being the case for May in 2023, but so far investors are showing resilience. That may mean if the Fed does not raise rates or signals that a pause in further rate hikes after May are likely, stocks could enjoy a further rally through May. This would be bullish.
For Tuesday, stocks will see a choppy market with dips likely but a potentially higher close.
Potential Economic and Political Market Moving Events
For this week the Fed’s interest rate decision on Wednesday followed by Friday’s April non-farm payroll numbers are the two key economic events that will move markets.
Tuesday:
10:00 Job openings
10:00 Factory orders