

Stocks tumbled on the S&P and NASDAQ on Monday. The S&P closed down 44 points for a 1% loss to close at 4188 back below the 4200 level. On Monday the index reached 4236 just 2 points below the all-time high set on Friday.
The NASDAQ had its worst day since March 18 when it lost 409 points. On Monday the index fell 350 points for a 2.5% loss to close at 13401. On March 18 when the NASDAQ fell it ended the day at 13,116. The index on Monday is just 285 points above that close. The NASDAQ all-time high was 14211.57. As of Monday’s close it is 809 points or 5.6% below the all-time high.
Let’s look at the closing technical indicators on Monday to see what they predict for Tuesday.
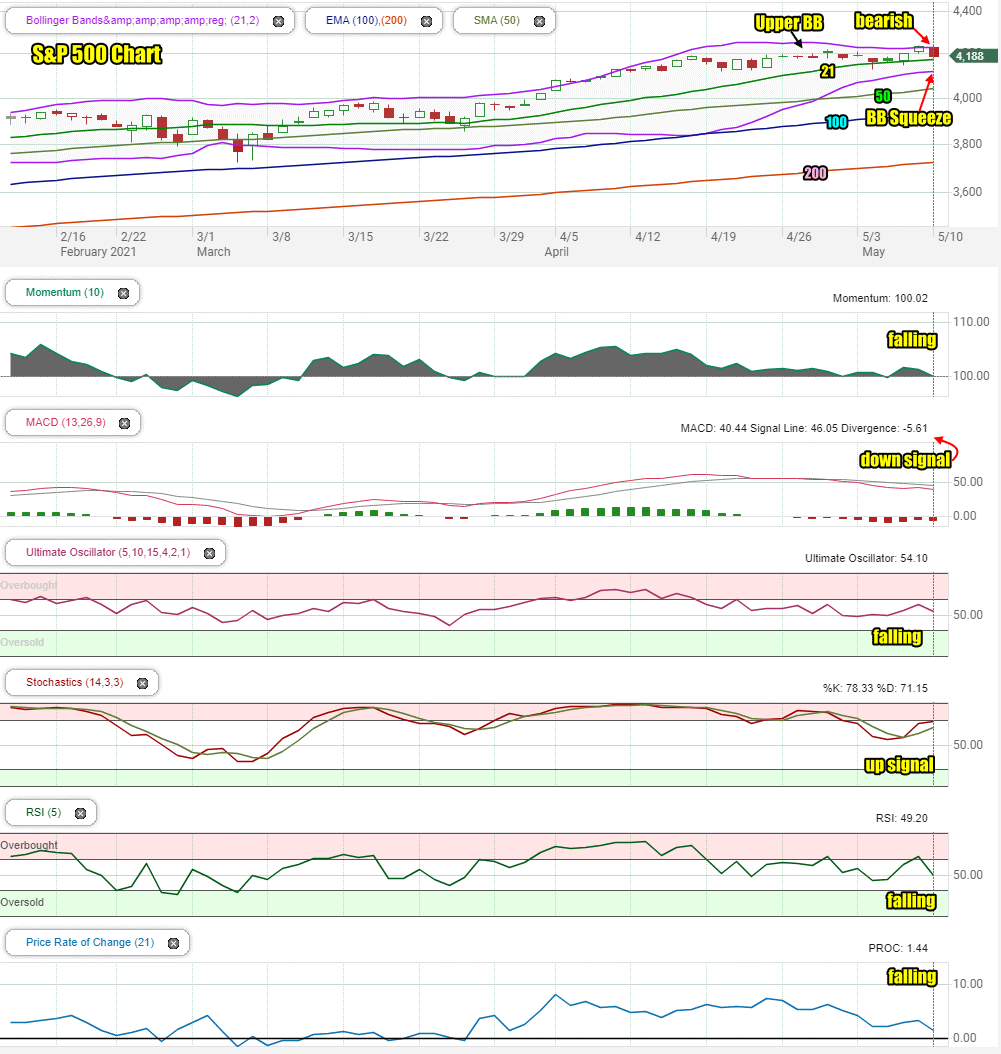
Stock Market Outlook Chart Comments At The Close on Mon May 10 2021
The Bollinger Bands Squeeze started to turn lower on Monday. On Friday it looked like there was a good chance the index would break higher. Now the squeeze looks like it may push the index lower.
The index closed back at the 21 day moving average and at the low of the day. Normally we can expect a bounce attempt off a closing low at the 21 day.
The closing candlestick on Monday is bearish for Tuesday.
The 21 day moving average is climbing higher and further away from the 50 day moving average which is bullish.
The 50, 100 and 200 day moving averages are all climbing higher.
Overall the S&P chart is still bullish but there are now 3 bearish signals in the chart advising some caution for investors.
Stock Market Outlook review of Mon May 10 2021
Stock Market Outlook: Technical Indicators Review:
Momentum: Momentum is positive but falling.
- Settings: For momentum I use a 10 period when studying market direction.
MACD Histogram: MACD (Moving Averages Convergence / Divergence) issued a down signal on Friday April 30 2021. On Monday the down signal gained strength.
- Settings: For MACD Histogram, I am using the Fast Points set at 13, Slow Points at 26 and Smoothing at 9.
Ultimate Oscillator: The Ultimate Oscillator is falling.
- Settings: The Ultimate Oscillator settings are: Period 1 is 5, Period 2 is 10, Period 3 is 15, Factor 1 is 4, Factor 2 is 2 and Factor 3 is 1. These are not the default settings but are the settings I use with the S&P 500 chart set for 1 to 3 months.
Slow Stochastic: The Slow Stochastic still has an up signal in place.
Settings: For the Slow Stochastic I use the K period of 14 and D period of 3. The Slow Stochastic tries to predict the market direction further out than just one day.
Relative Strength Index: The RSI signal is falling.
- Settings: The relative strength index is set for a period of 5 which gives it 5 days of market movement to monitor. It is often the first indicator to show an overbought or oversold signal.
Rate of Change: The rate of change signal is falling.
- Settings: Rate Of Change is set for a 21 period. This indicator looks back 21 days and compares price action from the past to the present. With the Rate Of Change, prices are rising when signals are positive. Conversely, prices are falling when signals are negative. As an advance rises the Rate Of Change signal should also rise higher, otherwise the rally is suspect. A decline should see the Rate Of Change fall into negative signals. The more negative the signals the stronger the decline.
Support and Resistance Levels To Be Aware Of:
4250 is resistance
4225 is resistance
4200 is resistance
4150 is light support
4100 is light support
4070 is very light support
4050 is light support
4000 is Support
3900 is support
3850 is support
3800 is support
3750 is good support
3700 is light support
3680 is light support
3600 is strong support
Stock Market Outlook for Tomorrow – Tue May 11 2021
The close on Monday was at the day’s low and on strong volume. Normally we should expect a further dip at the open on Tuesday and then a potential bounce attempt.
The technical indicators are moving back toward the bearish side once again and MACD which has signaled down for the SPX since April 30 gained more strength to the downside on Monday.
The Bollinger Bands Squeeze now looks set to push the index lower and indeed a closing below the 21 day moving average on Tuesday is likely.
Valuation Levels To Watch
SPX
For trading purposes you can see in the chart that the index has held the 4120 to 4125 valuations and tried to push higher from there. The attempts at breaking higher have met with selling. Buying volume over the past several weeks has declined which often precedes a decline or a dip. The level to watch is the 4120 to 4125 valuations for any close below it. With the latest rally being hindered by lower buying volume there is a good chance the SPX will drop to the 4120-4125 valuations to see how much support the rally from mid-April has. Any break below there and I plan to buy some further SPY Puts and Ultra Bear ETFs for the S&P.
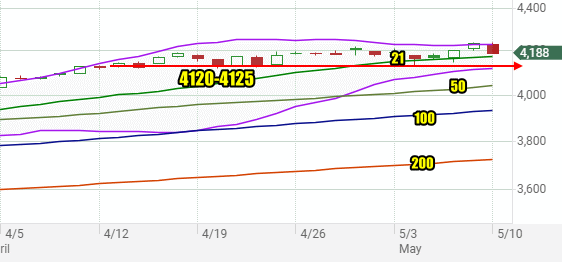
SPX: Valuation Levels To Watch
NASDAQ
The NASDAQ is already in a correction having fallen over 6% from the all-time high set on Apr 29. The Bollinger Bands Squeeze in the NASDAQ is already ending as the index is tumbling through the Lower Bollinger Band breaking the squeeze. The 21 day moving average is falling and the index last week reached the 50 day moving average three times while on Monday it broke through it and closed near the 100 day moving average. A decline to the 100 day seems likely which would be a 6.7% correction which is normal for a bull market pullback. Overall the NASDAQ looks poorer than the SPX but if the decline continues on the NASDAQ, the S&P will fall.
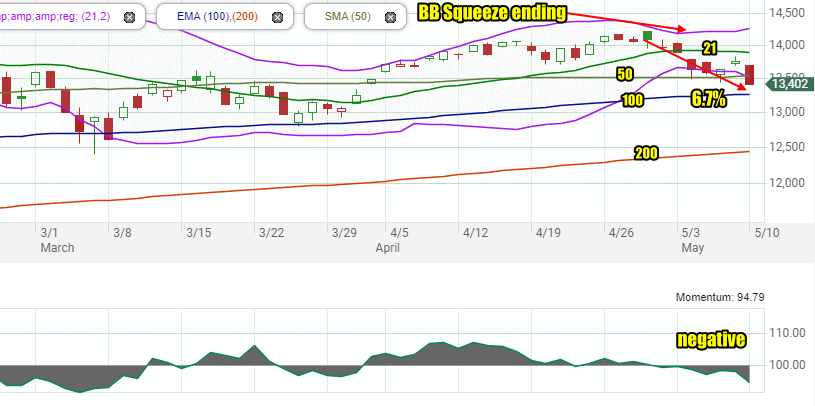
NASDAQ in correction
Summary Comments
Despite the drop on Monday, the majority of stocks on both the S&P and NASDAQ are making new 52 week highs and earnings are well beyond estimates for 80% of the companies that have reported so far. New York saw 713 new 52 week highs on Monday and the NASDAQ saw 332 new highs. Those numbers will of course drop if the indexes continue their decline. A lot of what we are seeing is profit-taking and especially sector rotations as investors are leaving the tech sector which rallied strongly this year and taking their profits, to move capital into other sectors they feel still have room for gains. As always, selling breeds more selling and many of those investors who are leaving tech names will return when buyers begin to pick through the carnage. For now though the 100 day is the moving average to watch for the NASDAQ and the SPX 4120 level is a point to consider buying some SPY puts for profits on a move down to the 50 day or 100 day.
At present, Tuesday has a good chance for a bounce and then another dip lower. With the levels identified above investors can prepare for a negative contingency should it happen. Just as easily stocks could find their footing and move back up. Overall though the rallies since mid-April have been choppy and unimpressive. That tells us the market may have to move lower to find waiting capital before trying again to make new highs. We should know this week which way the market intends to move next.
Stock Market Outlook Archives
Stock Market Outlook For Wed May 6 2026 – Choppy But Higher Still

Morning Investing Strategy Notes for Tue May 5 2026

Stock Market Outlook For Tue May 5 2026 – Overbought and Lower

Morning Investing Strategy Notes for Mon May 4 2026
Stock Market Outlook For Mon May 4 2026 – Dips Likely With Possible Lower Close

Morning Investing Strategy Notes for Fri May 1 2026
Stock Market Outlook For Fri May 1 2026 – Overbought But Higher

Morning Investing Strategy Notes for Thu Apr 30 2026
Stock Market Outlook For Thu Apr 30 2026 – Dips Likely Possible Lower Close
Morning Investing Strategy Notes for Wed Apr 29 2026
Stock Market Outlook For Wed Apr 29 2026 – Choppy But Higher Ahead Of More Earnings

Morning Investing Strategy Notes for Tue Apr 28 2026