

As investors continue to fixate on the escalating Russia-Ukraine war, markets continued their decline on Monday.
It was the single worst day for the S&P since March 18 2020 when the index lost 131 points in the pandemic collapse. Today the S&P lost 127.78 points for a loss of 2.95% and closed at 4201.
The NASDAQ lost 482 points for a 3.6% decline marking the worst day since Jan 5 2022 when it fell 522 points.
There were a number of signals intraday and after the close from the SPX index to advise that the selling is still not over. Let’s review Monday March 7 to see what to expect for Tuesday.
Stock Market Outlook Chart Comments At The Close on Mon Mar 7 2022
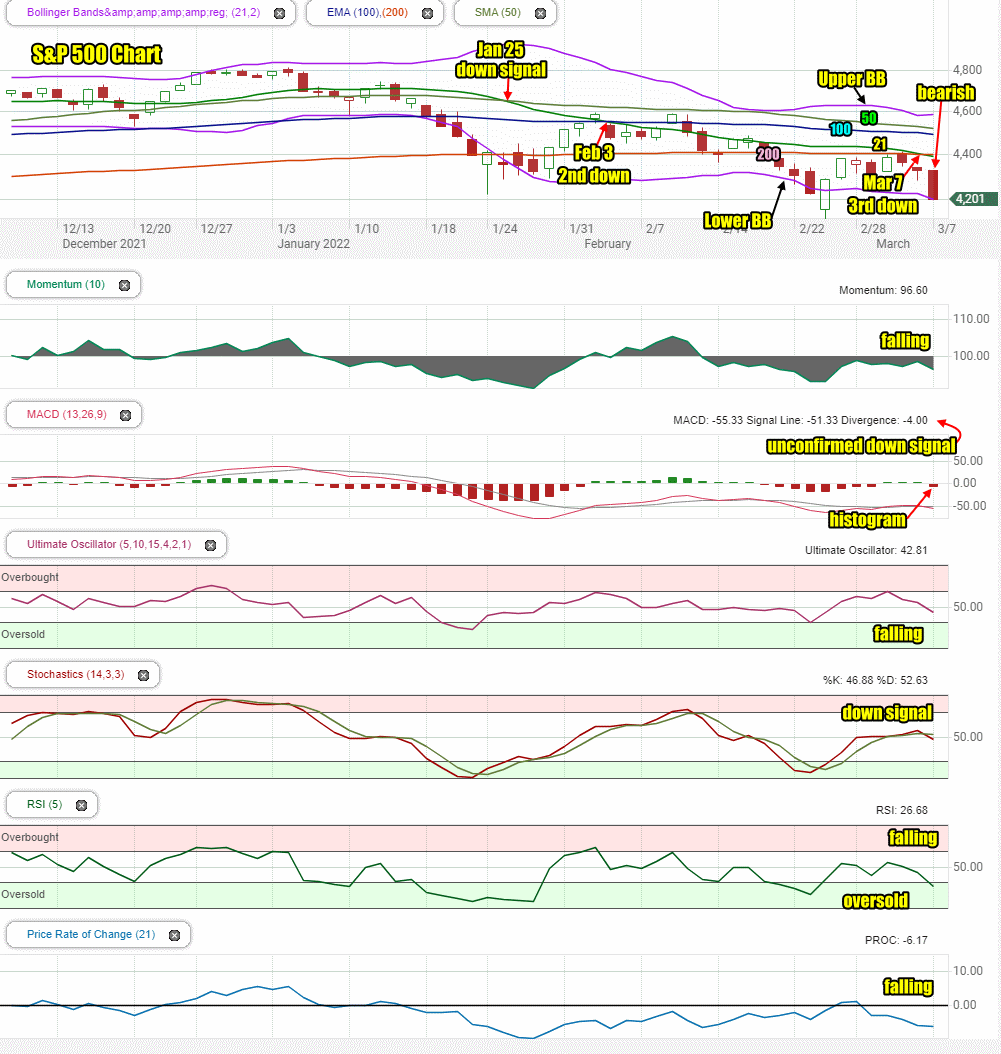
On Monday there were a number of new signals. The closing candlestick is bearish although often it is followed by a bounce attempt as the candlestick fell to the Lower Bollinger Band and pressured it lower.
Note how the Upper Bollinger Band is turning up after the day’s trading on Monday. Often this signals no Bollinger Bands Squeeze for the present but instead a chance for a bounce. Meanwhile the Lower Bollinger Band is turning down on Monday which indicates further selling is likely. Therefore any bounce on Tuesday or Wednesday I will be using to take profits and close trades. I will also use it to buy more SPY put options, going out to March 18 or March 25 expiry and probably the $420 put strike. The market looks set to move to 4100 and then 4000.
Also of importance is the 21 day moving average falling below the 200 day which issues a 3rd straight down signal. From Jan 25 to March 7 the 21 day has continually advised to put in place protection.
Meanwhile the 50 day moving average and 100 day moving average are both falling. The 50 day could fall below the 100 day this week which would be a fourth down signal should it occur.
All the major moving averages are falling lower with the 200 day still holding the 4400 level.
The chart remains very negative and Monday’s selling saw no panic but a steady erosion of valuations from most stocks. Normally this signals further downside still to come before this ends.
Stock Market Outlook review of Mon Mar 7 2022
Stock Market Outlook: Technical Indicators Review:
Momentum: Momentum is negative and falling but there is plenty of room to tumble lower before any strong bounce.
- Settings: For momentum I use a 10 period when studying market direction.
MACD Histogram: MACD (Moving Averages Convergence / Divergence) issued an up signal on Wednesday March 2. On Mon Mar 7 2022 MACD issued a strong but unconfirmed down signal. The MACD histogram is particularly negative pointing to further downside to come.
- Settings: For MACD Histogram, I am using the Fast Points set at 13, Slow Points at 26 and Smoothing at 9.
Ultimate Oscillator: The Ultimate Oscillator is negative and falling for a third straight day. There are no signals of a bounce from the Ultimate Oscillator.
- Settings: The Ultimate Oscillator settings are: Period 1 is 5, Period 2 is 10, Period 3 is 15, Factor 1 is 4, Factor 2 is 2 and Factor 3 is 1. These are not the default settings but are the settings I use with the S&P 500 chart set for 1 to 3 months.
Slow Stochastic: The Slow Stochastic has a down up signal in place.
Settings: For the Slow Stochastic I use the K period of 14 and D period of 3. The Slow Stochastic tries to predict the market direction further out than just one day.
Relative Strength Index: The RSI signal is falling and just entering oversold readings.
- Settings: The relative strength index is set for a period of 5 which gives it 5 days of market movement to monitor. It is often the first indicator to show an overbought or oversold signal.
Rate of Change: The rate of change signal is falling lower but not as sharply which often signals that the next day or two may not see dramatic large drops such as we saw on Monday.
- Settings: Rate Of Change is set for a 21 period. This indicator looks back 21 days and compares price action from the past to the present. With the Rate Of Change, prices are rising when signals are positive. Conversely, prices are falling when signals are negative. As an advance rises the Rate Of Change signal should also rise higher, otherwise the rally is suspect. A decline should see the Rate Of Change fall into negative signals. The more negative the signals the stronger the decline.
Support and Resistance Levels To Be Aware Of:
4500 is resistance
4490 is light resistance
4475 is light resistance
4450 is light resistance
4400 is good support and the 200 day moving average
4370 is light support
4350 is light support
4300 is good support
4290 is light support
4270 is light support
4250 is good support
4225 is light support
4200 is good support
4150 is good support
4000 is good support
Stock Market Outlook for Tomorrow – Tue Mar 8 2022
Monday’s market drop left behind a lot of technical damage. MACD has issued a new but unconfirmed down signal. I don’t think there is any question is will be confirmed on Tuesday. The remaining technical indicators are all signaling warnings that further downside should be expected. That means in bounces I will be buying SPY put options as outlined in the chart details above.
A new down signal came from the 21 day falling below the 200 day on Monday. This is the third straight down signal from this moving average. Investors could have bought put options on Jan 25 on the first down signal or Feb 3 on the second down signal and simply held them. The Ultra Bear ETFs are also a choice.
For Tuesday the large drop on Monday could see a bounce attempt but it won’t hold. The market needs a catalyst to the upside with the war escalating, analysts believe the economic impact is not yet known or being felt outside of Russia. That means further downside until the market finds a level where stocks are undervalued. At that point, selling will end. The only somewhat bullish signal on Monday came from the Rate Of Change which advised that Monday’s large drop will not be repeated on Tuesday. It does not signal any bounce however. None of the technical indicators are deeply into oversold readings. That means any bounce is technical, won’t last and sellers who now want out will use any bounce to get out of positions. Tuesday therefore will see a failed bounce attempt and probably a move to around 4150.
Stock Market Outlook Archives
Stock Market Outlook For Wed May 6 2026 – Choppy But Higher Still

Morning Investing Strategy Notes for Tue May 5 2026

Stock Market Outlook For Tue May 5 2026 – Overbought and Lower

Morning Investing Strategy Notes for Mon May 4 2026
Stock Market Outlook For Mon May 4 2026 – Dips Likely With Possible Lower Close

Morning Investing Strategy Notes for Fri May 1 2026
Stock Market Outlook For Fri May 1 2026 – Overbought But Higher

Morning Investing Strategy Notes for Thu Apr 30 2026
Stock Market Outlook For Thu Apr 30 2026 – Dips Likely Possible Lower Close
Morning Investing Strategy Notes for Wed Apr 29 2026
Stock Market Outlook For Wed Apr 29 2026 – Choppy But Higher Ahead Of More Earnings

Morning Investing Strategy Notes for Tue Apr 28 2026