

Prior Trading Day Summary:
On Monday trading volume was excellent with 5.9 billion shares traded on the NASDAQ and 4.8 billion on the S&P. Investors provided a choppy day of trading which by the close ended slightly negative but closer to flat.
The S&P ended the day down 6 points to 5131.
The NASDAQ closed down 67 points to close at 16207 which considering Apple and Tesla slipped, was not much of a loss.
The weakness on Monday was not unusual after the prior week which ended with Friday reaching all-time new highs.
On Tuesday investors get Target Earnings before the open and other retailers after the close. If Target earnings beat estimates stocks could rally further. If Target misses, we should see a weak open.
Lets review Monday’s closing technical indicators to see what we should expect for Tue Mar 5 2024.
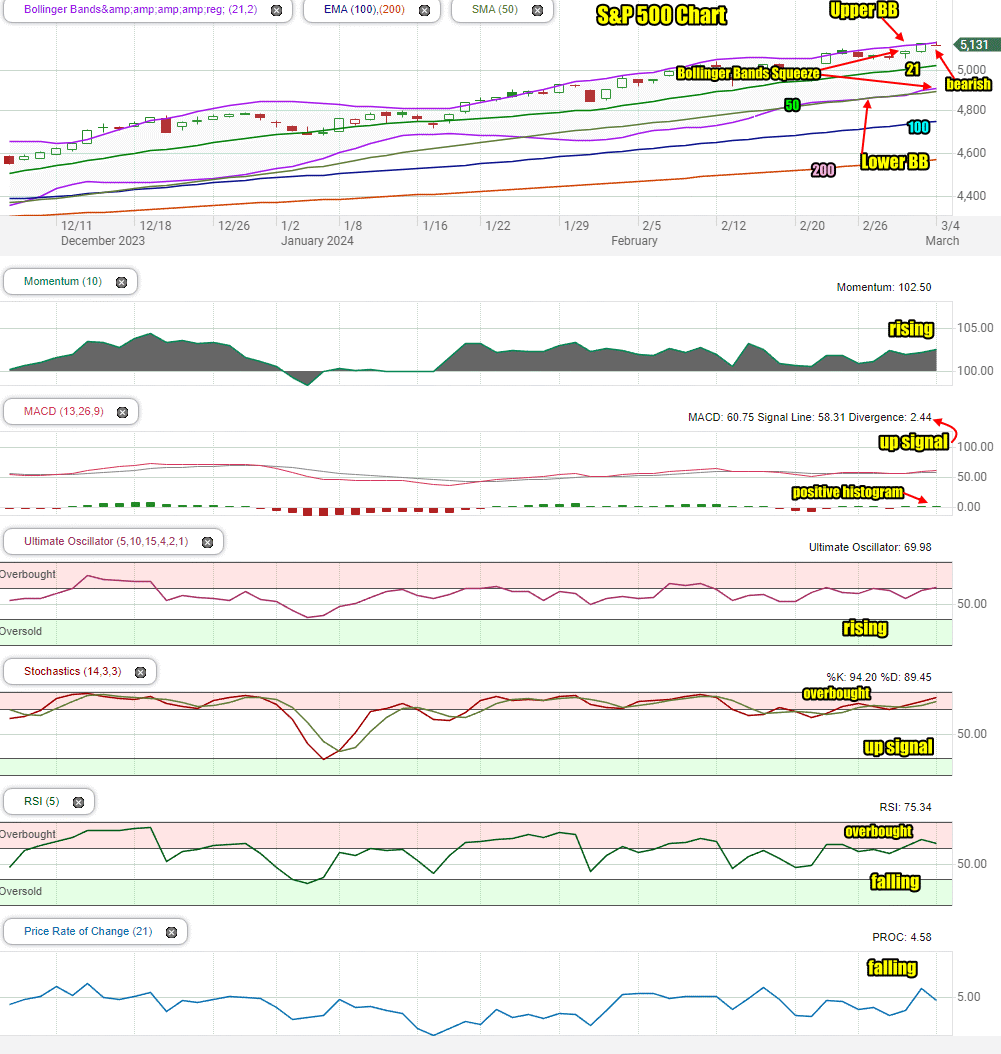
Stock Market Outlook: SPX Closing Chart For Tue Mar 5 2024
The index closed at the Upper Bollinger Band which is bullish.
The closing candlestick is bearish for Tuesday and is almost always followed by a weaker day.
The 21 day moving average is moving higher which is bullish. It is at 5028 on the SPX.
The 50 day moving average is rising and at 4898 which is bullish.
The 100 and 200 day moving averages are climbing which is bullish. The 200 day is at 4560 on the SPX which is bullish.
The Bollinger Bands are still in a Bollinger Bands Squeeze but with the Upper Bollinger Band rising while the Lower Bollinger Band is beginning to dip this is signaling stocks are moving higher out of the squeeze.
The S&P chart is more bullish than bearish for Tuesday but the closing candlestick is a warning.
Stock Market Outlook review of Mon Mar 4 2024
Stock Market Outlook: Technical Indicators Review
Momentum: Momentum is rising and positive.
|
MACD Histogram: MACD (Moving Averages Convergence / Divergence) issued an up signal on Thu Feb 29 2024. On Mon Mar 4 2024, the up signal gained strength.
|
Ultimate Oscillator: The Ultimate Oscillator is rising and positive.
|
Slow Stochastic: The Slow Stochastic has an up signal in place and is overbought.
|
Relative Strength Index: The RSI signal is falling and positive. It is overbought.
|
Rate of Change: The rate of change signal is falling and signaling a lower close is expected for Tuesday.
|
Stock Market Outlook: Support and Resistance Levels |
| 5150 is resistance |
| 5125 is resistance |
| 5115 is resistance |
| 5100 is resistance |
| 5090 is resistance |
| 5075 is resistance |
| 5050 is resistance |
| 5025 is resistance |
| 5010 is resistance |
| 5000 is resistance |
| 4990 is resistance |
| 4975 is resistance |
| 4950 is resistance |
| 4925 is support |
| 4915 is support |
| 4900 is support |
| 4875 is support |
| 4850 is support |
| 4825 is support |
| 4815 is support |
| 4800 is support |
Stock Market Outlook for Tue Mar 5 2024
Today we get a good idea how well retailers are doing. Target releases their latest quarterly results before the open. Investors are mixed on what to expect. After the close we get earnings from Ross Stores and Nordstrom. Misses will create further weakness on Tuesday and probably into Wednesday’s morning. Also after hours today we get earnings from Crowdstrike.
Investors on Tuesday may be a bit hesitant to push stocks a lot higher until they see earnings today and get some idea of Fed comments on Wednesday when Fed Chair Powell testifies in front of Congress.
For Tuesday watch for dips and some weakness. The only change to that outlook will come if Target beats estimates widely. If that happens, that should be enough to see a positive close.
Potential Economic and Political Market Moving Events
This is a busy week for reports with Fed Chair powell testifying before Congress on Wednesday and Thursday along with February unemployment numbers on Friday.
Monday:
No economic reports due out.
Tuesday:
10:00 Factory orders are expected to slip to -3.1%
10:00 ISM services are estimated to be slightly weaker at 53.0% from 53.4% prior.