
So was it “fake news” that sent stock markets plunging on Monday? According to trade advisor Peter Navarro, the market was overreacting to fears the administration would restrict foreign investment as part of its trade actions against China and other countries. He indicated in a later afternoon interview that there were “mo plans to impose investment restrictions on China or others.” However media outlets, world-wide, ran stories indicating otherwise. The Financial Times wrote “The Trump administration has decided to restrict Chinese investment in US companies and start-ups in sectors from aerospace to robotics as it prepares to deploy its latest weapon in the escalating trade war with Beijing.” With articles like those from Financial Times, the selling at times was intense. The tech sector was particularly hard hit. At one point the Dow was down over 500 points before comments from Peter Navarro seeming in contradiction to the articles, calmed the markets enough that they closed off the lows of the day.
However a day like today usually leaves some form of damage that takes time to work out.
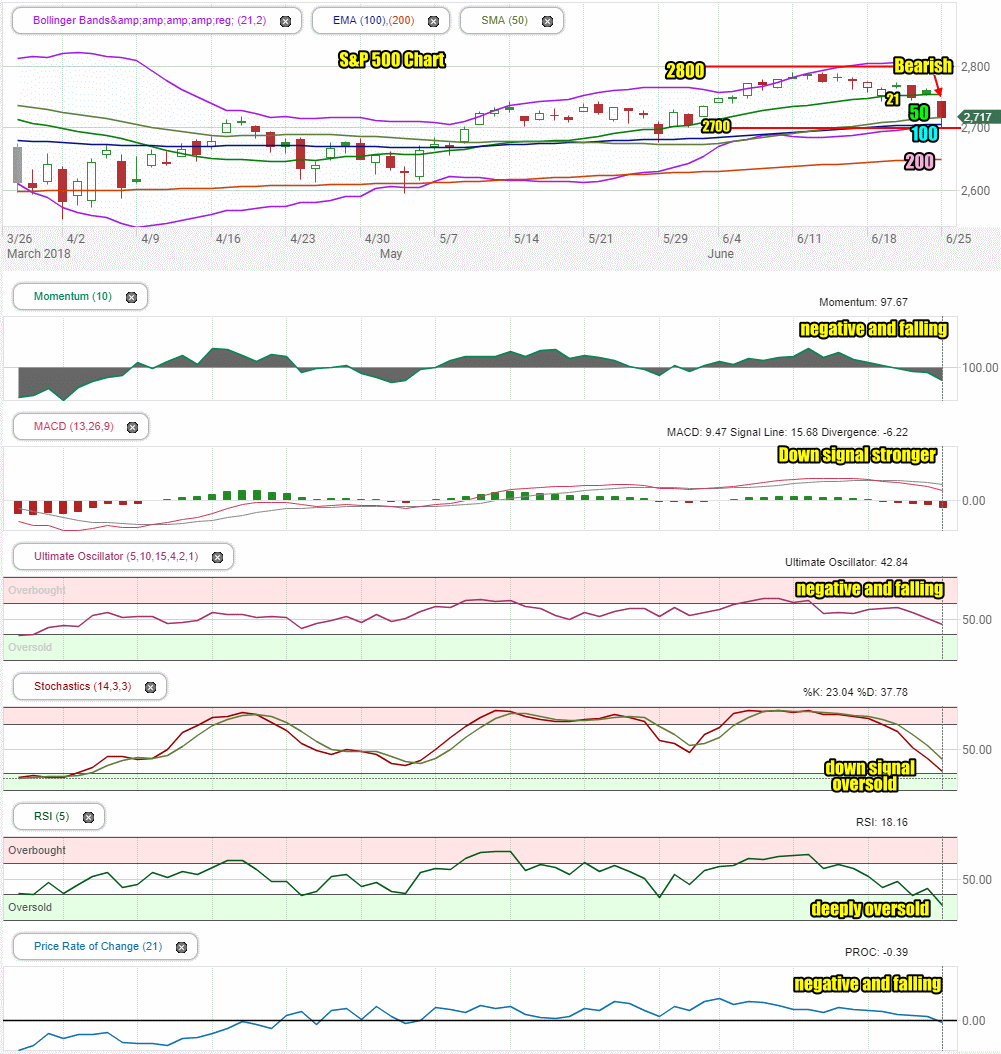
Stock Market Outlook Chart Comments At The Close on Mon Jun 25 2018
Stocks closed off their lows but took a beating nonetheless.
The plunge sent the index below the 50 day down to the 100 day before it bounced to close at the 50 day moving average.
The market reached the 2700 level during the day and closed above it at 2717. Overall the chart has turned somewhat bearish but aside from a bearish candlestick there are still signs that the market is more range bound than ready to collapse deeper.
Stock Market Outlook review of Mon Jun 25 2018
Stock Market Outlook: Technical Indicators Review:
Momentum: For momentum I use a 10 period when studying market direction. Momentum is negative and falling.
MACD Histogram: For MACD Histogram, I am using the Fast Points set at 13, Slow Points at 26 and Smoothing at 9.MACD (Moving Averages Convergence / Divergence) issued a a down signal on Jun 19. It was stronger on Monday.
Ultimate Oscillator: The Ultimate Oscillator settings are: Period 1 is 5, Period 2 is 10, Period 3 is 15, Factor 1 is 4, Factor 2 is 2 and Factor 3 is 1. These are not the default settings but are the settings I use with the S&P 500 chart set for 1 to 3 months. The Ultimate Oscillator signal is negative and falling.
Slow Stochastic: For the Slow Stochastic I use the K period of 14 and D period of 3. The Slow Stochastic tries to predict the market direction further out than just one day. The Slow Stochastic is signaling lower for the index and is oversold.
Relative Strength Index: The relative strength index is set for a period of 5 which gives it 5 days of market movement to monitor. It is often the first indicator to show an overbought or oversold signal. The RSI signal is falling and oversold.
Rate of Change: Rate Of Change is set for a 21 period. This indicator looks back 21 days and compares price action from the past to the present. With the Rate Of Change, prices are rising when signals are positive. Conversely, prices are falling when signals are negative. As an advance rises the Rate Of Change signal should also rise higher, otherwise the rally is suspect. A decline should see the Rate Of Change fall into negative signals. The more negative the signals the stronger the decline. The rate of change signal is negative and falling.
Support Levels To Be Aware Of:
2745 to 2750 is light support
2725 is light support.
2700 is support.
2675 is light support.
2650 is light support
2620 is light support
2600 is strong support.
There is good support at the 2550 level from where the market bounced back from the recent correction low on Feb 9.
The S&P has light support at 2480. It also has light support at 2450 and good support at 2425. Below that there is some support at 2400, 2380, 2350. 2300 has the most support at present but would represent a full correction as a drop to this level would be 20% and just 5% away from a potential bear market signal.
Stock Market Outlook for Tomorrow – Tue Jun 26 2018
Technically damage was done on Monday but much of it was also the result of the “unknown news” and what may or may not be the next move in the escalating trade wars.
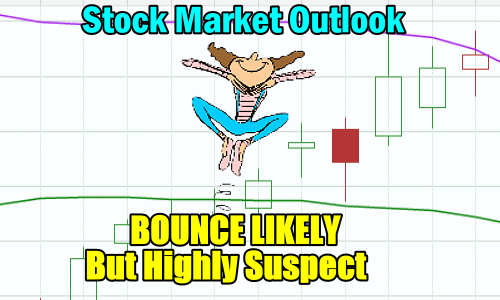
Tuesday should open slightly higher and then dip back and then climb higher. The technical indicators are negative and pointing lower but many are also oversold. This should see the index try to bounce back but it will be suspect until we see a number of closings, each one higher than the previous.
On Tuesday I am expecting a choppy day with a large bounce attempt, some heavy selling at times but with the potential for a positive close. Much is unknown at this point with the tariff “wars” and what may come next. That will continue to keep stocks on edge. For that reason Tuesday could end higher but Wednesday could just as easily end lower. That means stay cautious, take on smaller trades but focus on protecting capital first and profits second.
Stock Market Outlook Archives
Stock Market Outlook For Wed May 6 2026 – Choppy But Higher Still

Morning Investing Strategy Notes for Tue May 5 2026

Stock Market Outlook For Tue May 5 2026 – Overbought and Lower

Morning Investing Strategy Notes for Mon May 4 2026
Stock Market Outlook For Mon May 4 2026 – Dips Likely With Possible Lower Close

Morning Investing Strategy Notes for Fri May 1 2026
Stock Market Outlook For Fri May 1 2026 – Overbought But Higher

Morning Investing Strategy Notes for Thu Apr 30 2026
Stock Market Outlook For Thu Apr 30 2026 – Dips Likely Possible Lower Close
Morning Investing Strategy Notes for Wed Apr 29 2026
Stock Market Outlook For Wed Apr 29 2026 – Choppy But Higher Ahead Of More Earnings

Morning Investing Strategy Notes for Tue Apr 28 2026