

Prior Trading Day Summary:
Monday saw investors continue to leave chip stocks which pressured both the S&P and the NASDAQ lower.
The S&P fell 16 points to 5447 but 72% of all volume was to the upside and 64% of all stocks were rising.
The NASDAQ was lower by 192 points to close at 17,496 but again 48% of all volume was advancing and 51% of all stocks were rising.
Let’s review the technical indicators from the close on Mon Jun 24 2024 to see what to expect on Tue Jun 25 2024.
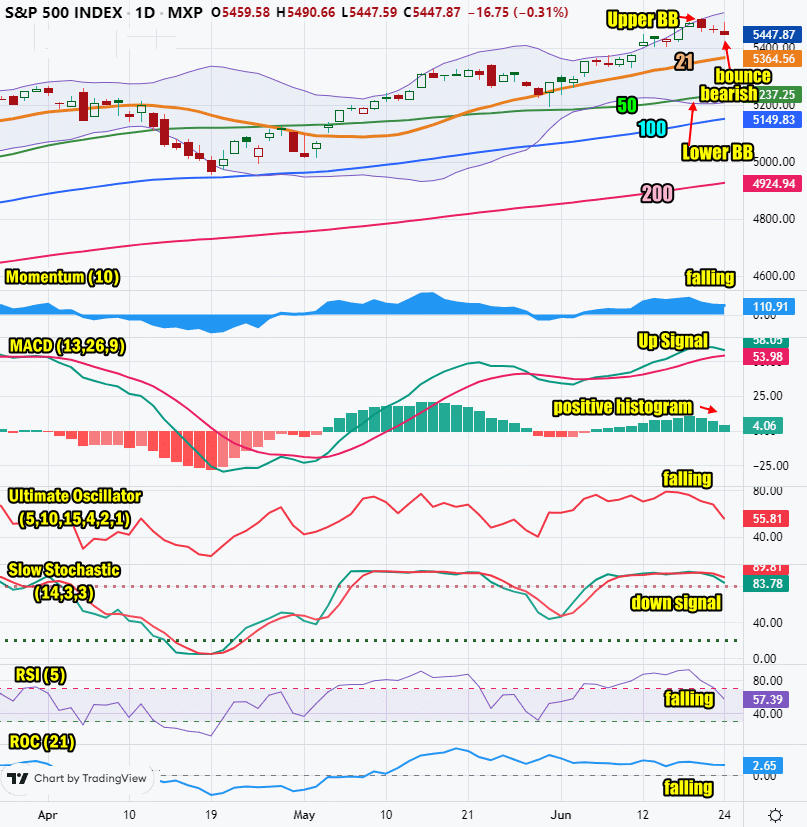
Stock Market Outlook: SPX Closing Chart For Mon Jun 24 2024
The index closed above the 21 day moving average but further below the Upper Bollinger Band. This is bearish.
The closing candlestick however is pointing to the potential for a bounce but normally we can expect the index to slip to at least the 21 day before attempting a sustainable bounce.
The 21 day moving average is still climbing continuing the latest up signal.
The 50 day moving average is climbing which is bullish.
The 200 day moving average is still climbing. The 200 day is at 4925 which is bullish and the 100 day is also climbing to 5150.
The Lower Bollinger Band is below the 50 day moving average and the Upper Bollinger Band is rising. This is bullish but note that the Lower Bollinger Band is turning up on Monday which needs to be watched for any change in the trend.
The S&P chart is more bearish for Tuesday but signaling a bounce should be expected.
SPX Stock Market Outlook review of Mon Jun 24 2024
Stock Market Outlook: Technical Indicators Review
Momentum: Momentum is falling and positive.
|
MACD Histogram: MACD (Moving Averages Convergence / Divergence) issued an up signal on Thu Jun 6 2024. On Mon Jun 24 2024 the up signal was weaker. The MACD histogram lost more strength. You can see in the chart that the move lower in strength is steady for a third straight day. There is a good chance we may see a down signal this week from MACD indicator.
|
Ultimate Oscillator: The Ultimate Oscillator is falling and positive.
|
Slow Stochastic: The Slow Stochastic has a down signal in place and is overbought.
|
Relative Strength Index: The RSI signal is falling and still positive.
|
Rate of Change: The rate of change signal is falling signaling that Tuesday will end lower.
|
Stock Market Outlook: Support and Resistance Levels |
| 5500 is resistance |
| 5490 is resistance |
| 5475 is resistance |
| 5465 is resistance |
| 5450 is resistance |
| 5425 is resistance |
| 5400 is resistance |
| 5375 is resistance |
| 5350 is resistance |
| 5325 is resistance |
| 5310 is resistance |
| 5300 is support |
| 5275 is support |
| 5250 is light support |
| 5225 is light support |
| 5200 is good support |
| 5190 is light support |
Stock Market Outlook for Tue Jun 25 2024
For Tue Jun 25 2024 the SPX closing candlestick is signaling we should see a better attempt at a bounce but the technical indicators are advising weakness is growing.
NVIDIA Stock (NVDA) fell further on Monday. If it continues to fall on Tuesday the day will end lower.
Potential Economic and Political Market Moving Events
The biggest economic events this week are Durable Goods on Thursday and PCE numbers on Friday.
Monday:
No economic reports but 3 Fed officials are speaking today.
Tuesday:
9:00 S&P Case-Shiller home price index is expected to be unchanged at 7.4%
10:00 Consumer confidence is expected to be 100, down just slightly from 102 prior.