

Day’s Summary
On Friday the overbought markets pulled back as investors took a breather ahead of the long weekend. Historically the week after the long weekend has been negative 83% of the time since 1984. That’s quite a record but at the same time the loss has averaged just over 1%. After last week’s monster rally, investors are bound to want to take some profits and reposition trades and portfolios.
By the close of the day the S&P was down 16 points to 4409. There is little support in the SPX at the present levels so a dip below 4400 is probable for Monday.
The NASDAQ fell 93 points to end the day at 13,689. Intraday the NASDAQ had moved above 13800 at the start of the day but the index is very overbought. The chance of a move still higher was slim for Friday and will be slim to start the week.
Volumes on Friday were still quite good because Friday was triple witching. Overall though I had thought volatility would have been higher with wider swings in the indexes. That did not happen.
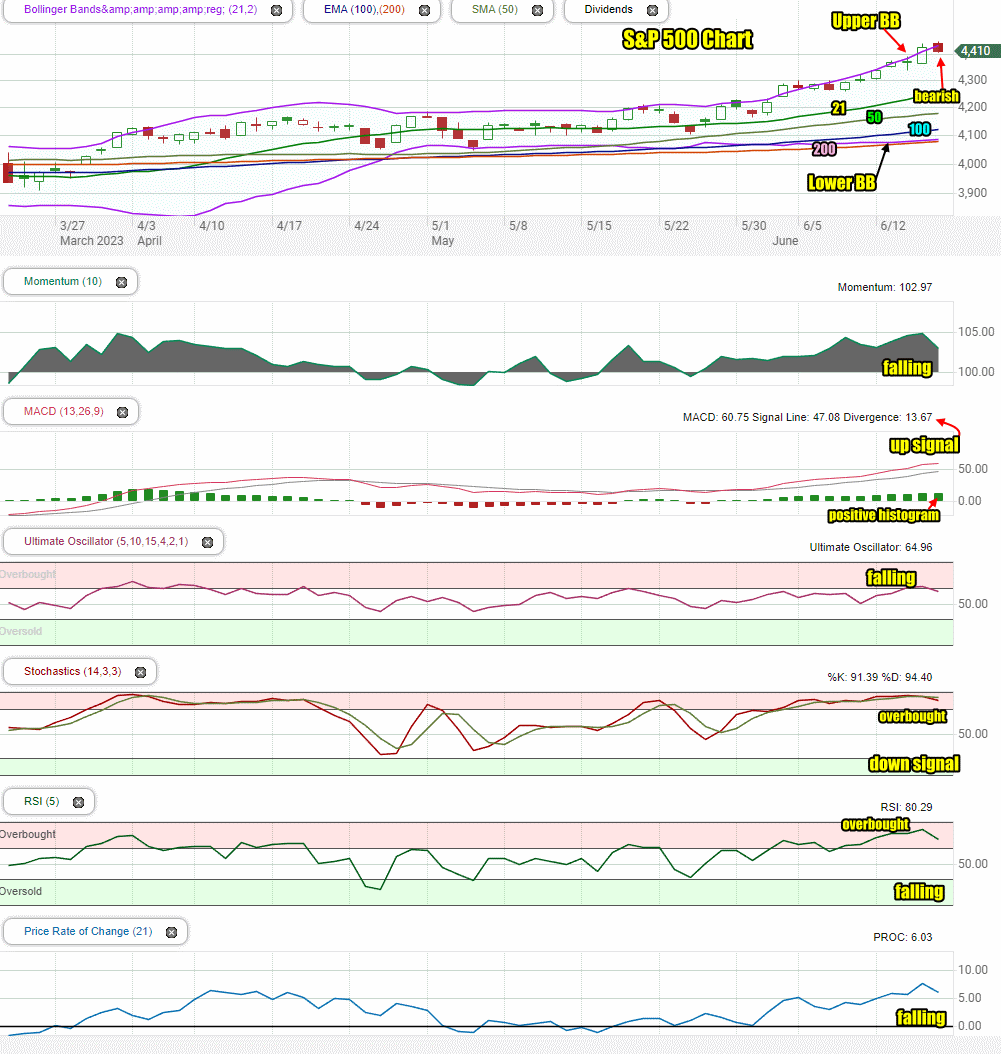
Let’s review the SPX closing technical indicators from Fri Jun 16 2023 to see what to expect for Tue Jun 20 2023.
Stock Market Outlook: SPX Closing Chart For Fri Jun 16 2023
The index closed just below the Upper Bollinger Band which is bullish.
The closing candlestick is bearish to start the week.
All major moving averages continue to climb and the Lower Bollinger Band is falling while the 200 day is climbing. Both are bullish. The Lower Bollinger Band appears ready to fall below the 200 day, another bullish signal.
The S&P chart is solidly bullish but continues to warn that the market remains overbought. There are no down signals in the chart.
Stock Market Outlook review of Fri Jun 16 2023
Stock Market Outlook: Technical Indicators Review
Momentum: Momentum is falling and positive.
|
MACD Histogram: MACD (Moving Averages Convergence / Divergence) issued an up signal on Friday May 26. The up signal was a bit weaker on Friday. The MACD histogram remains strong.
|
Ultimate Oscillator: The Ultimate Oscillator is falling and no longer overbought.
|
Slow Stochastic: The Slow Stochastic has a weak down signal in place. It is signaling overbought.
|
Relative Strength Index: The RSI signal is falling and positive. It is signaling overbought.
|
Rate of Change: The rate of change signal is falling and positive.
|
Stock Market Outlook: Support and Resistance Levels |
| 4450 is resistance |
| 4435 is resistance |
| 4420 is resistance |
| 4400 is strong resistance |
| 4390 is resistance |
| 4370 is resistance |
| 4350 is resistance |
| 4340 is resistance |
| 4325 is resistance |
| 4310 is resistance |
| 4300 is resistance |
| 4290 is resistance |
| 4275 is support |
| 4250 is support |
| 4240 is support |
| 4225 is support |
| 4210 is support |
| 4200 is good support |
| 4190 is support |
| 4180 is support |
Stock Market Outlook for Tue Jun 20 2023
For Tuesday the technical indicators are more mixed with a few still signaling overbought and others losing some strength. None are yet signaling a down move coming.
Despite no down signal, Monday looks weak to start off the third week of June.
For Tuesday expect stocks to see selling pressure with a lower close to the day.
Potential Economic and Political Market Moving Events
Tuesday:
8:30 Housing starts