

Prior Trading Day Summary:
On Mon Jul 7 2025 more tariff “talk” gave investors a reason to take profits. With stock indexes at historic highs,profit-taking was obvious for the start of the week, especially after the long July 4th weekend.
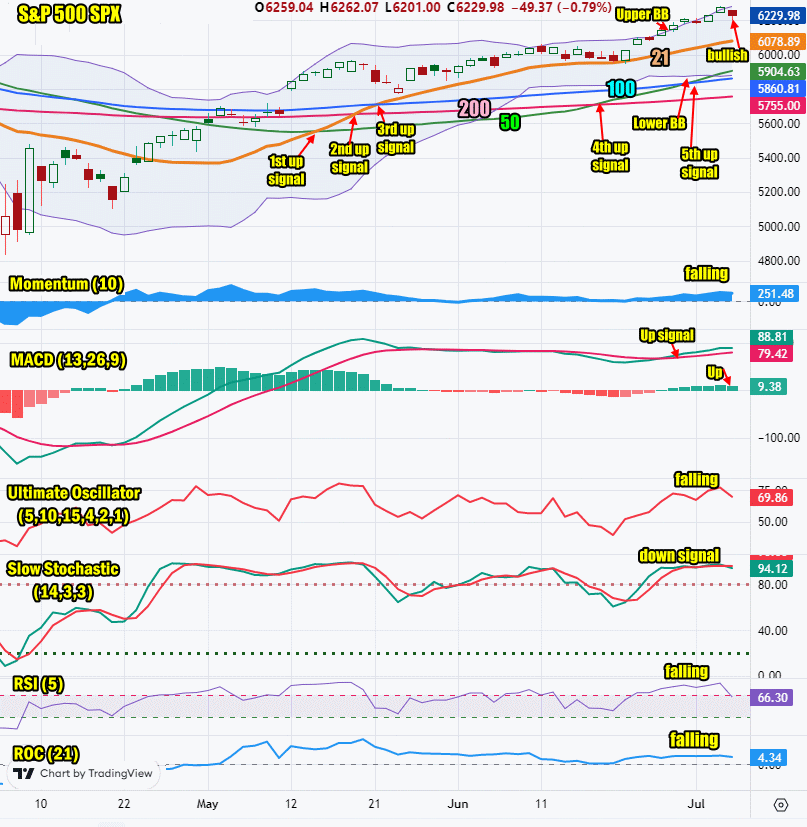
The SPX fell 49 points to close at 6229 on 5.3 billion shares. 77% of stocks were declining which shows us that selling was broad-based across most sectors.
The NASDAQ fell 188 points to 20,412. Volume was 8.5 billion with 59% of the volume being traded lower and 71% of all stocks declining.
Let’s review the technical indicators at the close on Mon Jul 7 2025 to see what they predict for Tue Jul 8 2025.
Stock Market Outlook: SPX Closing Chart For Mon Jul 7 2025
The index closed just below the Upper Bollinger Band. This is bullish.
The closing candlestick is bearish for Tuesday but with a long shadow there is a strong possibility of a bounce.
The 21 day moving average is rising and closed at 6078 which is bullish.
The 50 day moving average is rising and closed at 5904 which is bullish.
The 100 day moving average is rising and closed at 5860 which is bullish.
The 200 day moving average is rising and closed at 5755 which is bullish.
The Lower Bollinger Band is falling below the 50 day moving average and moving lower, nearing the 100 day moving average. This is bullish. The Upper Bollinger Band is rising which is bullish.
The SPX chart is strongly bullish despite Monday’s dip.
SPX Stock Market Outlook review of Mon Jul 7 2025
Stock Market Outlook: Technical Indicators Review
Momentum: Momentum is falling and positive.
|
MACD Histogram: MACD (Moving Averages Convergence / Divergence) issued an up signal on Thu June 26. On Mon Jul 7 2025 the up signal lost strength.
|
Ultimate Oscillator: The Ultimate Oscillator is falling.
|
Slow Stochastic: The Slow Stochastic changed to a down signal.
|
Relative Strength Index: The RSI signal is falling.
|
| Rate of Change: The rate of change signal is falling signaling Tuesday will end lower. Settings: Rate Of Change is set for a 21 period. This indicator looks back 21 days and compares price action from the past to the present. With the Rate Of Change, prices are rising when signals are positive. Conversely, prices are falling when signals are negative. As an advance rises, the Rate Of Change signal should also rise higher, otherwise the rally is suspect. A decline should see the Rate Of Change fall into negative signals. The more negative the signals the stronger the decline. |
Stock Market Outlook: Support and Resistance Levels |
| 6300 is resistance |
| 6250 is resistance |
| 6225 is resistance |
| 6200 is resistance |
| 6175 is resistance |
| 6150 is resistance |
| 6125 is resistance |
| 6100 is resistance |
| 6075 is resistance |
| 6050 is resistance |
| 6025 is resistance |
| 6015 is resistance |
| 6000 is resistance |
| 5990 is support |
| 5975 is support |
| 5950 is support |
| 5925 is support |
| 5900 is support |
| 5850 is support |
| 5800 is support |
| 5785 is support |
| 5750 is support |
| 5700 is support |
Stock Market Outlook for Tue Jul 8 2025
On Monday the real winners were the media outlets that finally had some “bad” news to talk about. As stocks moved lower media outlets brought out more bears with dire predictions. I am ignoring that. The index looks set to try for a bounce although the close still looks negative for Tuesday. There are no economic or political events that should affect stocks on Tuesday. More tariff talk is likely which could keep sellers in the mood to unload more shares but every dip since the star of April have been buying opportunities. I think we will find Monday’s dip was another opportunity.
Potential Economic and Political Market Moving Events
Monday:
no events are scheduled
Tuesday:
6:00 NFIB optimism index is unchanged at 98.8
3:00 Consumer credit is estimated to fall to $10.0 billion from $17.9 billion prior.