
 Prior Trading Day Summary
On Mon Jul 28 2025 stocks closed only slightly higher but the MACD technical indicator finally issued an up signal. While unconfirmed, I am expected the signal to get confirmed today.
The S&P ended up just 1 point but intraday the SPX touched the 6400 valuation which is bullish.
The NASDAQ rose 70 points to close at 21,178 on 11.1 billion shares traded.
Let’s review the closing technical indicators from Mon Jul 28 2025 to see what to expect for Tue Jul 29 2025.
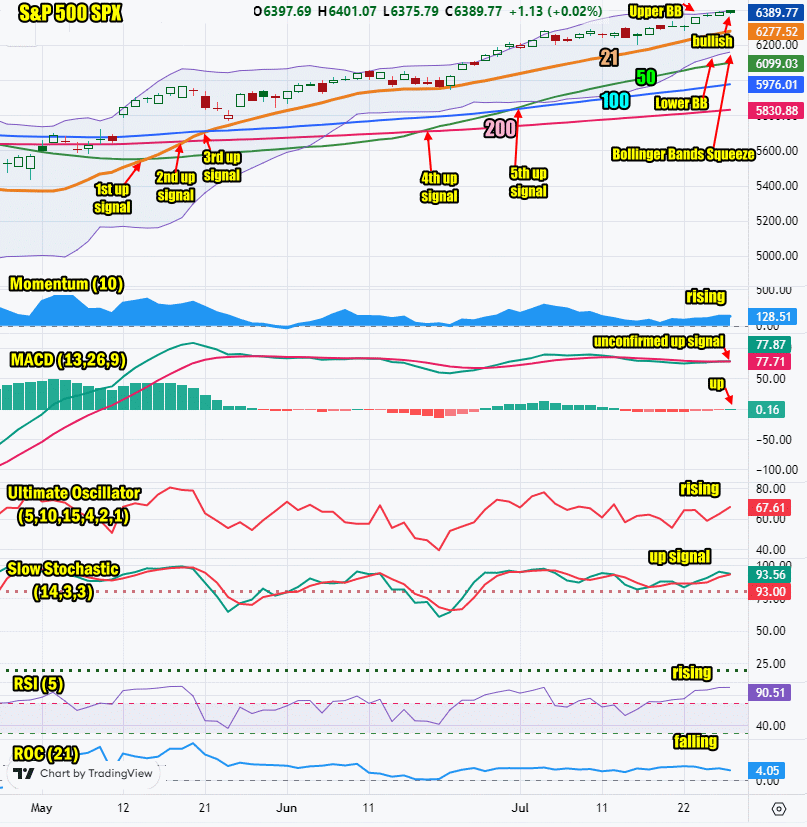
Stock Market Outlook: SPX Closing Chart For Mon Jul 28 2025
The index closed at the Upper Bollinger Band marking another new closing high. This is bullish.
The closing candlestick is bullish for Tuesday.
The 21 day moving average is rising and closed at 6277 which is bullish.
The 50 day moving average is rising and closed at 6099 which is bullish.
The 100 day moving average is rising and closed at 5976 which is bullish.
The 200 day moving average is rising and closed at 5830 which is bullish.
The Lower Bollinger Band is rising and above the 50 day moving average which is bullish. The Upper Bollinger Band is back to rising. The Bollinger Bands Squeeze commenced on Wednesday last week. At present the outlook is for stocks to move higher out of the Bollinger Bands Squeeze.
The SPX chart is more bullish than bearish heading into Tue Jul 29 2025.
SPX Stock Market Outlook review of Mon Jul 28 2025
Stock Market Outlook: Technical Indicators Review
Momentum: Momentum is rising and positive.
|
MACD Histogram: MACD (Moving Averages Convergence / Divergence) issued a down signal on Tue Jul 15. On Mon Jul 28 2025 a new unconfirmed up signal was generated. The signal is quite weak at present.
|
Ultimate Oscillator: The Ultimate Oscillator is rising.
|
Slow Stochastic: The Slow Stochastic has an up signal in place.
|
Relative Strength Index: The RSI signal is rising.
|
| Rate of Change: The rate of change signal is falling, signaling a lower close for Tuesday. Settings: Rate Of Change is set for a 21 period. This indicator looks back 21 days and compares price action from the past to the present. With the Rate Of Change, prices are rising when signals are positive. Conversely, prices are falling when signals are negative. As an advance rises, the Rate Of Change signal should also rise higher, otherwise the rally is suspect. A decline should see the Rate Of Change fall into negative signals. The more negative the signals the stronger the decline. |
Stock Market Outlook: Support and Resistance Levels |
| 6390 is resistance |
| 6365 is resistance |
| 6350 is resistance |
| 6325 is resistance |
| 6300 is resistance |
| 6250 is resistance |
| 6225 is resistance |
| 6200 is resistance |
| 6175 is resistance |
| 6150 is resistance |
| 6125 is resistance |
| 6100 is support |
| 6075 is support |
| 6050 is support |
| 6025 is support |
| 6000 is support |
| 5990 is support |
| 5975 is support |
| 5950 is support |
| 5925 is support |
| 5900 is support |
Stock Market Outlook for Tue Jul 29 2025
For Tuesday the day starts with a new unconfirmed up signal from the MACD technical indicators. This is one of the more accurate signals to watch.
Tuesday will see a bit more choppy trading but the close is still expected to be higher.
Potential Economic and Political Market Moving Events
Monday:
There are no events
Tuesday:
8:30 Advanced trade balance in goods is estimated at -$96.6 billion
8:30 Advanced retail inventories is estimated at 0.3%
8:30 Advanced wholesale inventories is estimated at -0.3%
9:00 Case Shiller home price index is estimated at 3.0%
10:00 Consume confidence is estimated at 95.4 up from 93.0 prior
10:00 Job openings are estimated at 7.5 million, down from 7.8 million prior