
Mon Jan 4 2021 saw the index make a new opening all-time high and then fear of the potential outcome of the Georgia Senate run-off elections sent stocks lower. As more investors took profits, the selling drew still more investors and by 12:15 the index had slipped to 3662. That though was the end of the selling. A small bounce and then a second attempt to sell the index lower failed at 12:50 and buyers returned. By the close the index had retaken the 3700 level and reduced the sell-off to a loss of 55 points. The S&P closed down 1.4% to 3700.65.
Stock Market Outlook Chart Comments At The Close on Mon Jan 4 2021
On Monday the index closed back at the 21 day moving average. By midday the index had fallen to the Lower Bollinger Band which had resulted in a bounce back.
The close at the 21 day left behind a long red candlestick which is bearish for Tuesday.
The Bollinger Bands Squeeze continues to be in play. We won’t know the result of Monday’s action until Tuesday’s close for the Bollinger Bands Squeeze but by the close on Monday, the Upper Bollinger Band had started to turn lower.
The major moving averages are still rising and the up signal from Oct 21 is still in play but the break of the 21 day on Monday needs to be watched for any further bearish signals. For now, the drop could be a one day event.

Stock Market Outlook review of Mon Jan 4 2021
Stock Market Outlook: Technical Indicators Review:
Momentum: Momentum is falling and turned negative.
- Settings: For momentum I use a 10 period when studying market direction.
MACD Histogram: MACD (Moving Averages Convergence / Divergence) issued a a down signal on Dec 10. The down signal was stronger on Monday by the close.
- Settings: For MACD Histogram, I am using the Fast Points set at 13, Slow Points at 26 and Smoothing at 9.
Ultimate Oscillator: The Ultimate Oscillator is falling.
- Settings: The Ultimate Oscillator settings are: Period 1 is 5, Period 2 is 10, Period 3 is 15, Factor 1 is 4, Factor 2 is 2 and Factor 3 is 1. These are not the default settings but are the settings I use with the S&P 500 chart set for 1 to 3 months.
Slow Stochastic: The Slow Stochastic has a down signal in place.
Settings: For the Slow Stochastic I use the K period of 14 and D period of 3. The Slow Stochastic tries to predict the market direction further out than just one day.
Relative Strength Index: The RSI signal is falling.
- Settings: The relative strength index is set for a period of 5 which gives it 5 days of market movement to monitor. It is often the first indicator to show an overbought or oversold signal.
Rate of Change: The rate of change signal is falling.
- Settings: Rate Of Change is set for a 21 period. This indicator looks back 21 days and compares price action from the past to the present. With the Rate Of Change, prices are rising when signals are positive. Conversely, prices are falling when signals are negative. As an advance rises the Rate Of Change signal should also rise higher, otherwise the rally is suspect. A decline should see the Rate Of Change fall into negative signals. The more negative the signals the stronger the decline.
Support and Resistance Levels To Be Aware Of:
3750 is resistance
3700 is light support
3600 is strong support
3550 is support
3500 is strong support
3450 is support
3400 is support
3375 is support
3300 is strong support
3275 is support
3200 is support
3150 is support
3050 is support
3000 is strong support
Stock Market Outlook for Tomorrow – Tue Jan 5 2021
The drop on Monday wiped out the gain for the S&P from last week. That means the Santa Claus Rally gains from last week are now in jeopardy. The problem with Monday’s drop was the reason was political and not economic. Historically however, it has never mattered what the cause for a lack of the Santa Claus Rally. If the market moves lower tomorrow and there is no Santa Claus Rally the adage is “If Santa Claus Should Fail To Call Bears May Come To Broad and Wall”. Just remember that while the adage holds true about 75% of the time, it is not infallible.
The technical indicators have all turned down. The Rate Of Change however is indicating that we should not expect a big swing up or down tomorrow and that could be the case as the run-off elections are held and many investors may want to wait on the sidelines for the results.
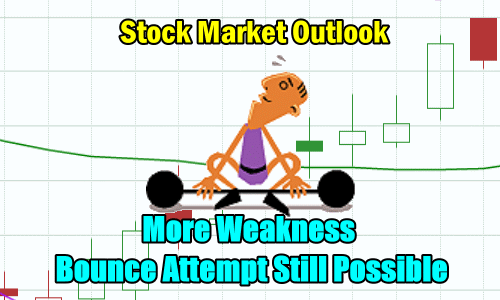
For now the indicators are advising Tuesday will end lower however a bounce would not be a surprise either. The outlook then is for weakness with a bounce possible.
Stock Market Outlook Archives
Stock Market Outlook For Wed May 6 2026 – Choppy But Higher Still

Morning Investing Strategy Notes for Tue May 5 2026

Stock Market Outlook For Tue May 5 2026 – Overbought and Lower

Morning Investing Strategy Notes for Mon May 4 2026
Stock Market Outlook For Mon May 4 2026 – Dips Likely With Possible Lower Close

Morning Investing Strategy Notes for Fri May 1 2026
Stock Market Outlook For Fri May 1 2026 – Overbought But Higher

Morning Investing Strategy Notes for Thu Apr 30 2026
Stock Market Outlook For Thu Apr 30 2026 – Dips Likely Possible Lower Close
Morning Investing Strategy Notes for Wed Apr 29 2026
Stock Market Outlook For Wed Apr 29 2026 – Choppy But Higher Ahead Of More Earnings

Morning Investing Strategy Notes for Tue Apr 28 2026