

What Happened On Mon Jan 29 2018
Concerns over Apple Stock took the wind out of the tech sector on the S&P. It fell almost a full 1% on Monday and that pushed other sectors to join the selling. Caterpillar was another big loser falling $4.48. Chevron was down 2% along with Coca Cola down 1.71% and VISA down 1.17% dragging the Dow down 177 points.
With the end of January on the horizon, worries about Apple’s upcoming earnings on Thursday after markets close coupled with 10 year Treasury note yields at their highest since 2014 was enough to have investors take profits from what has been a terrific month. We are probably going to see more selling on Tuesday. Let’s take a look.
Closing Statistics for Mon Jan 29 2018
S&P 500 Index Close
The S&P index ended down 19.34 to 2853.53
Dow Jones Index Close
The Dow Jones ended down 177.23 to 26,439.48
NASDAQ Index Close
The NASDAQ closed down 39.27 to 7466.50
Stock Market Outlook – Review of Mon Jan 29 2018
Chart Comments At The Close:
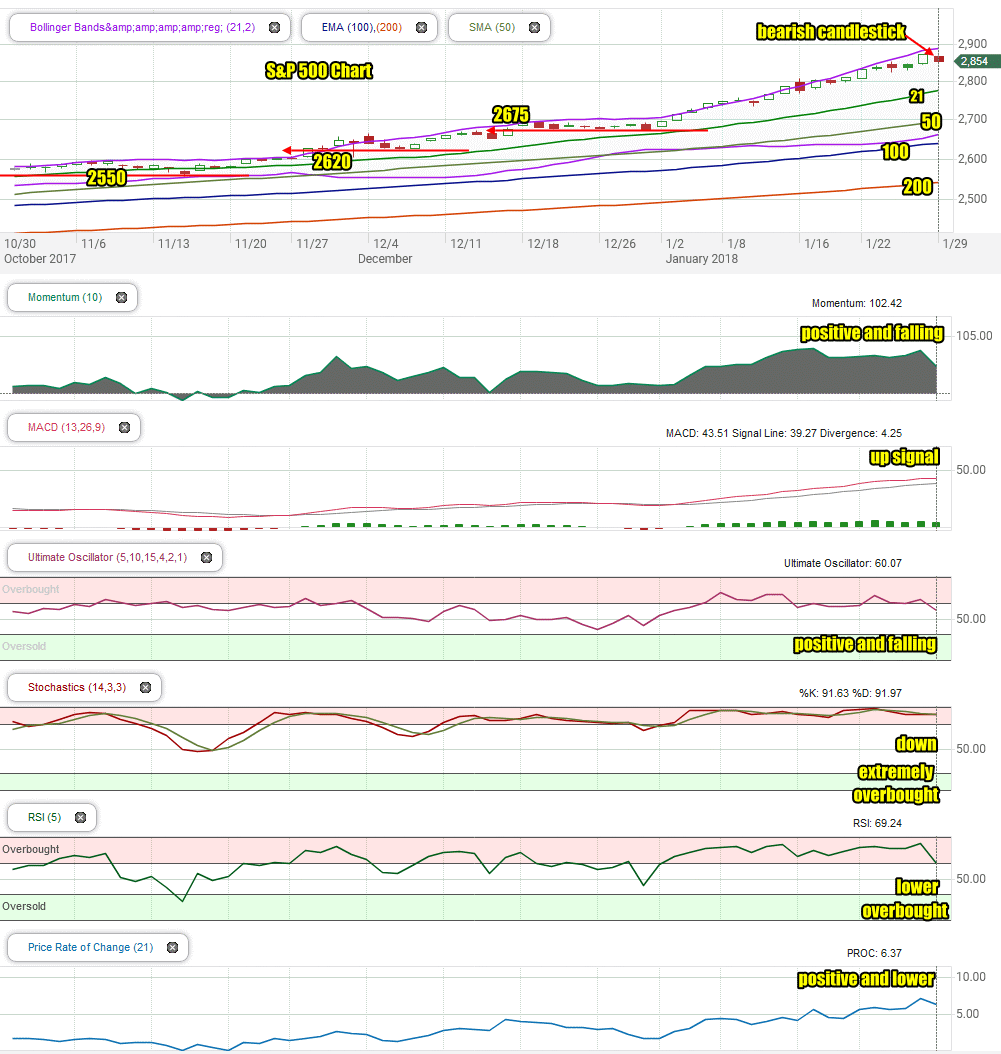
Monday saw the S&P move inside the Upper Bollinger Band which is back to what we saw on Wednesday and Thursday last week. Today’s selling was enough to leave behind a bearish candlestick for Tuesday. All the moving averages are continuing to rise, but you can see the Lower Bollinger Band is starting to turn higher which often can be a signal of an end to a run in the index before the next phase enters.
Stock Market Outlook review of Mon Jan 29 2018
Stock Market Outlook: Technical Indicators:
All the signals turned lower and lost strength on Monday.
Momentum: For momentum I use a 10 period when studying market direction. Momentum is positive and moving lower.
MACD Histogram: For MACD Histogram, I am using the Fast Points set at 13, Slow Points at 26 and Smoothing at 9. MACD (Moving Averages Convergence / Divergence) issued a buy signal on Jan 4. That buy signal lost some strength on Monday.
Ultimate Oscillator: The Ultimate Oscillator settings are: Period 1 is 5, Period 2 is 10, Period 3 is 15, Factor 1 is 4, Factor 2 is 2 and Factor 3 is 1. These are not the default settings but are the settings I use with the S&P 500 chart set for 1 to 3 months. The Ultimate Oscillator signal is positive and lower.
Slow Stochastic: For the Slow Stochastic I use the K period of 14 and D period of 3. The Slow Stochastic tries to predict the market direction further out than just one day. The Slow Stochastic is extremely overbought and has a very weak down signal in place.
Relative Strength Index: The relative strength index is set for a period of 5 which gives it 5 days of market movement to monitor. It often is the first indicator to show an overbought or oversold signal. The RSI signal is also extremely overbought and moving lower.
Rate of Change: Rate Of Change is set for a 21 period. This indicator looks back 21 days and compares price action from the past to the present. The rate of change signal is positive and moving lower but continuing staying at its best readings since July 2016.
Support Levels To Be Aware Of:
2675 and 2620 are light support.
There is good support at the 2550 level.
The S&P has light support at 2480. It also has light support at 2450 and good support at 2425. Below that there is some support at 2400, 2380, 2350. 2300 has the most support at present but would represent a full correction as a drop to this level would be almost 15%.
Stock Market Outlook for Tomorrow – Tue Jan 30 2018
Today’s selling turned all the technical indicators lower but the signals still have extremely strong readings despite the selling today. Investors are always a nervous bunch and with many stocks holding stellar gains, it isn’t surprising to see selling happen when news such as the Apple news on the iphoneX sales numbers, be the excuse to take profits. The signals are pointing to probably a second day of weakness on Tuesday but we could see the market turn around on any good news. This is a big week for stocks with big corporate names announcing earnings. Everyone from Apple, Microsoft, Alphabet, Amazon, Electronic Arts Stock (EA) and many others are reporting. We also have the State of the Union address on Tuesday. Jobs numbers on Friday. This is a busy week and volatility which gained some traction last week, looks set to stay with the market probably for the entire week.
For Tuesday look for more selling and news this evening of MetLife delaying their earnings, won’t help Tuesday’s opening.
Market Direction Internal Links
Profiting From Understanding Market Direction (Articles Index)
Understanding Short-Term Signals
Market Direction Portfolio Trades (Members)
Market Direction External Links
IWM ETF Russell 2000 Fund Info
Market Direction SPY ETF 500 Fund Info