
What Happened On Friday Jan 12 2018
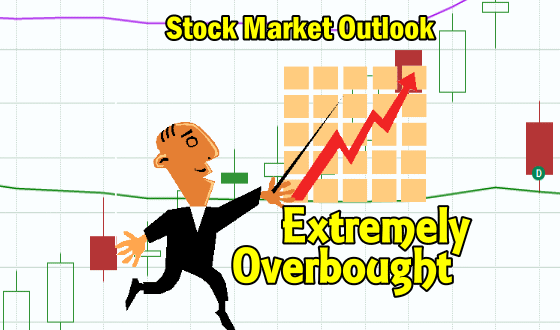
All three indexes moved higher on Friday capping off a second week of very strong gains. With the indexes making new highs again on Friday, the indexes are very overbought.
Closing Statistics for Friday Jan 12 2018
S&P 500 Index Close
The S&P index ended up 18.68 to 2786.24
Dow Jones Index Close
The Dow Jones ended up 228.46 to 25,803.19
NASDAQ Index Close
The NASDAQ closed up 49.29 to 7261.06
Stock Market Outlook – Review of Friday Jan 12 2018
Chart Comments At The Close:
Friday saw the S&P closed above the Upper Bollinger Band for the sixth time in seven trading days, a remarkable feat and a clear signal of a bullish market. The close on Friday left behind a bullish candlestick for Tuesday. All the major moving averages are still rising pointing to further upside for the rally.
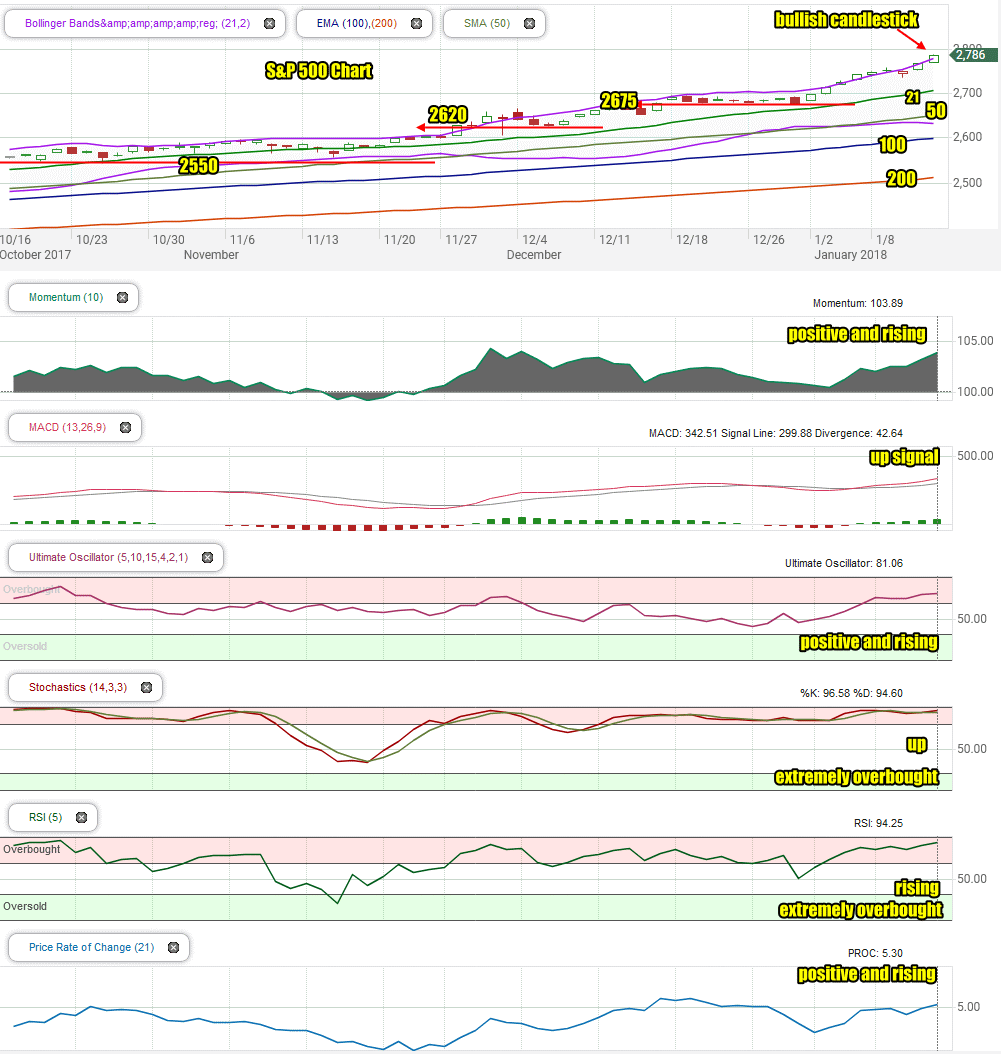
Stock Market Outlook review of Jan 12 2018
Stock Market Outlook: Technical Indicators:
Momentum: For momentum I use a 10 period when studying market direction. Momentum is positive and moved higher still on Friday.
MACD Histogram: For MACD Histogram, I am using the Fast Points set at 13, Slow Points at 26 and Smoothing at 9. MACD (Moving Averages Convergence / Divergence) issued a buy signal on Jan 4. The buy signal is ended Friday on a very strong reading for this upcoming week.
Ultimate Oscillator: The Ultimate Oscillator settings are: Period 1 is 5, Period 2 is 10, Period 3 is 15, Factor 1 is 4, Factor 2 is 2 and Factor 3 is 1. These are not the default settings but are the settings I use with the S&P 500 chart set for 1 to 3 months. The Ultimate Oscillator signal is positive, overbought and climbing.
Slow Stochastic: For the Slow Stochastic I use the K period of 14 and D period of 3. The Slow Stochastic tries to predict the market direction further out than just one day. The Slow Stochastic is extremely overbought but ended Friday with an up signal from Tuesday.
Relative Strength Index: The relative strength index is set for a period of 5 which gives it 5 days of market movement to monitor. It often is the first indicator to show an overbought or oversold signal. The RSI signal is also extremely overbought and still rising.
Rate of Change: Rate Of Change is set for a 21 period. This indicator looks back 21 days and compares price action from the past to the present. The rate of change signal is positive and rising.
Support Levels To Be Aware Of:
2675 and 2620 are light support.
There is good support at the 2550 level.
The S&P has light support at 2480. It also has light support at 2450 and good support at 2425. Below that there is some support at 2400, 2380, 2350. 2300 has the most support at present but would represent a full correction as a drop to this level would be almost 15%.
Stock Market Outlook for Tomorrow – Tue Jan 16 2018
The technical indicators are positive for Tuesday but many are now showing extreme overbought readings. Relative Strength Index (RSI) for example is at 94.25 which is a very high reading. There is still room to the upside but normally readings this high will see dips.
Tuesday should start off with a “bang” following the long holiday weekend. Then we could see some sideways action and weakness develop. The close however should still be positive for the S&P on Tuesday.
Market Direction Internal Links
Profiting From Understanding Market Direction (Articles Index)
Understanding Short-Term Signals
Market Direction Portfolio Trades (Members)
Market Direction External Links
IWM ETF Russell 2000 Fund Info
Market Direction SPY ETF 500 Fund Info