

Monday saw the expected selling as stocks are overbought and the indexes are well ahead of themselves at this point in the rally. The low of the day was made by 10:30 and the rest of the day the index traded in a tight range from roughly 4105 to 4115. It closed down just 25 points at 4111.
The NASDAQ slipped 119.50 points to close at 11887.
Many investors were on the sidelines ahead of Fed Chair Powell’s speech on Tuesday. Despite this, losses were minor and did nothing to break the bullish pattern.
Let’s review the closing technical indicators from the SPX on Mon Feb 6 to see what to expect for Tue Feb 7.
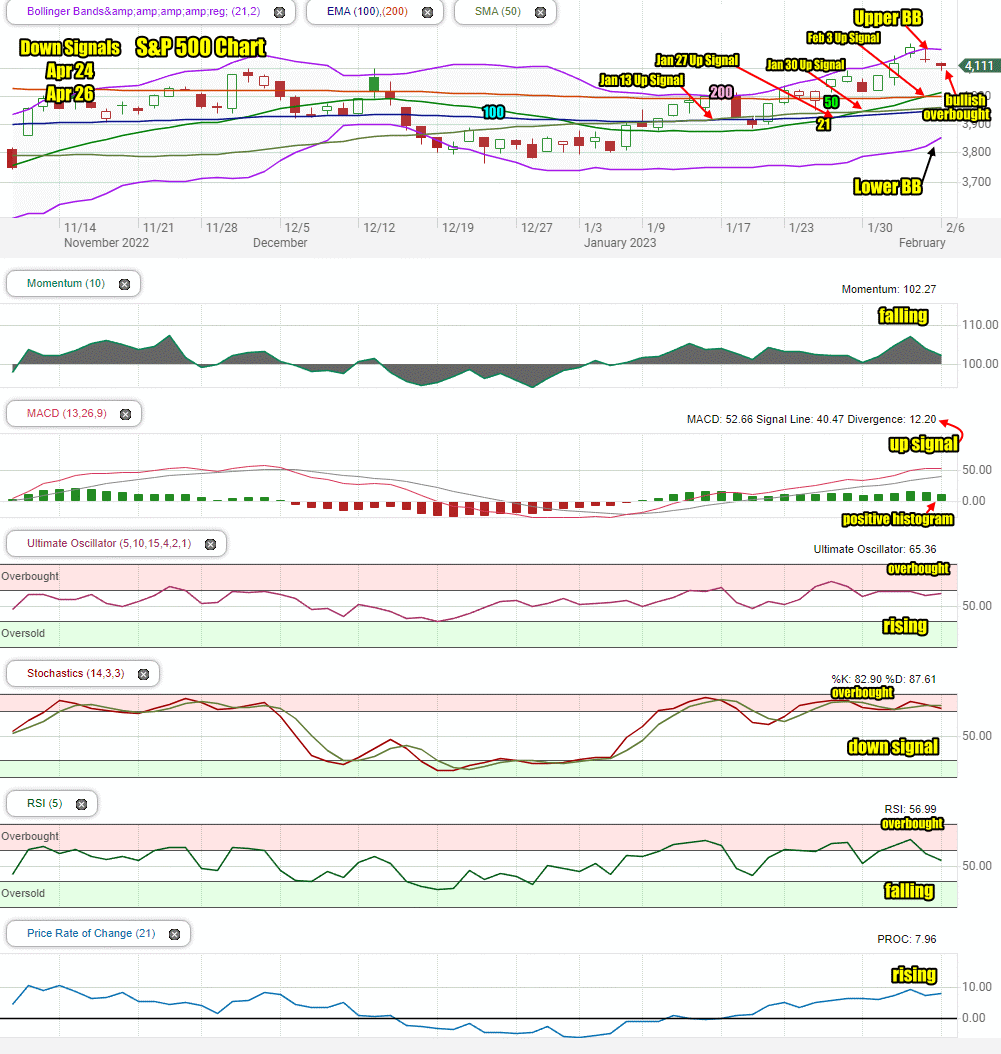
Stock Market Outlook Chart Comments At The Close on Mon Feb 6 2023
On Mon Feb 6 2023 the S&P traded lower but still above the 200 day moving average.
The closing candlestick is bullish for Tuesday although again it points to the market as overbought.
The Upper Bollinger Band is turned sideways which is bearish. The Lower Bollinger Band is still rising which is bullish.
The 200 day moving average is rising which is bullish. All the major averages are now rising.
The 21 day moving average is above the 200 day with a new up signal on Friday Feb 3. That ended the down signal from Sep 13.
At present there are 2 down signals in place since April 24 and 4 up signals since Jan 13.
The chart is 65% bullish for Tuesday. It lost some strength with the Upper Bollinger Band turning sideways. That has to be watched for a possible signal into a Bollinger Bands Squeeze later this week.
Stock Market Outlook review of Mon Feb 6 2023
Stock Market Outlook: Technical Indicators Review:
Momentum: Momentum is falling but positive.
- Settings: For momentum I use a 10 period when studying market direction.
MACD Histogram: MACD (Moving Averages Convergence / Divergence) issued an up signal on Monday Jan 9. The up signal lost some strength on Monday as did the histogram.
- Settings: For MACD Histogram, I am using the Fast Points set at 13, Slow Points at 26 and Smoothing at 9.
Ultimate Oscillator: The Ultimate Oscillator is rising and just below overbought readings.
- Settings: The Ultimate Oscillator settings are: Period 1 is 5, Period 2 is 10, Period 3 is 15, Factor 1 is 4, Factor 2 is 2 and Factor 3 is 1. These are not the default settings but are the settings I use with the S&P 500 chart set for 1 to 3 months.
Slow Stochastic: The Slow Stochastic has a weak down signal in place and is very overbought.
Settings: For the Slow Stochastic I use the K period of 14 and D period of 3. The Slow Stochastic tries to predict the market direction further out than just one day.
Relative Strength Index: The RSI signal is falling and leaving overbought signals.
- Settings: The relative strength index is set for a period of 5 which gives it 5 days of market movement to monitor. It is often the first indicator to show an overbought or oversold signal.
Rate of Change: The rate of change signal is rising and positive.
- Settings: Rate Of Change is set for a 21 period. This indicator looks back 21 days and compares price action from the past to the present. With the Rate Of Change, prices are rising when signals are positive. Conversely, prices are falling when signals are negative. As an advance rises the Rate Of Change signal should also rise higher, otherwise the rally is suspect. A decline should see the Rate Of Change fall into negative signals. The more negative the signals the stronger the decline.
Support and Resistance Levels To Be Aware Of:
4250 is resistance
4220 is resistance
4200 is resistance
4180 is resistance
4150 is resistance
4125 is resistance
4100 is resistance
4090 is resistance
4075 is resistance
4050 is resistance
4030 is light support
4025 is light support
4000 is light support
3975 is light support
3965 is light support
3950 is good support
3930 is light support
3900 is good support
3875 is light support
3850 is good support
3830 is good support
3810 is light support
3800 is good support
3775 is good support
3750 is good support
Stock Market Outlook for Tomorrow – Tue Feb 7 2023
For Tuesday the technical indicators are starting the day mixed with a number of indicators falling and some up indicators losing strength. Depending on Fed Chair Powell’s speech, investors may decide to sell stocks lower on Tuesday. The technical indicators though are pointing to stocks as seeing some weakness but still managing to either hold with just slight losses or move higher and close positive on the day.
Potential Economic and Political Market Moving Events
The next major event is Fed Chair Powell’s speech on Tuesday at 12:40.
Tuesday:
8:30 International trade deficit
12:40 Fed Chair Powell speaks at Economic Club of Washington. This is his first speech since the stunning January payroll numbers were released last Friday.
3:00 Consumer Credit
Stock Market Outlook Archives
Stock Market Outlook For Wed May 6 2026 – Choppy But Higher Still

Morning Investing Strategy Notes for Tue May 5 2026

Stock Market Outlook For Tue May 5 2026 – Overbought and Lower

Morning Investing Strategy Notes for Mon May 4 2026
Stock Market Outlook For Mon May 4 2026 – Dips Likely With Possible Lower Close

Morning Investing Strategy Notes for Fri May 1 2026
Stock Market Outlook For Fri May 1 2026 – Overbought But Higher

Morning Investing Strategy Notes for Thu Apr 30 2026
Stock Market Outlook For Thu Apr 30 2026 – Dips Likely Possible Lower Close
Morning Investing Strategy Notes for Wed Apr 29 2026
Stock Market Outlook For Wed Apr 29 2026 – Choppy But Higher Ahead Of More Earnings

Morning Investing Strategy Notes for Tue Apr 28 2026