
 Prior Trading Day Summary:
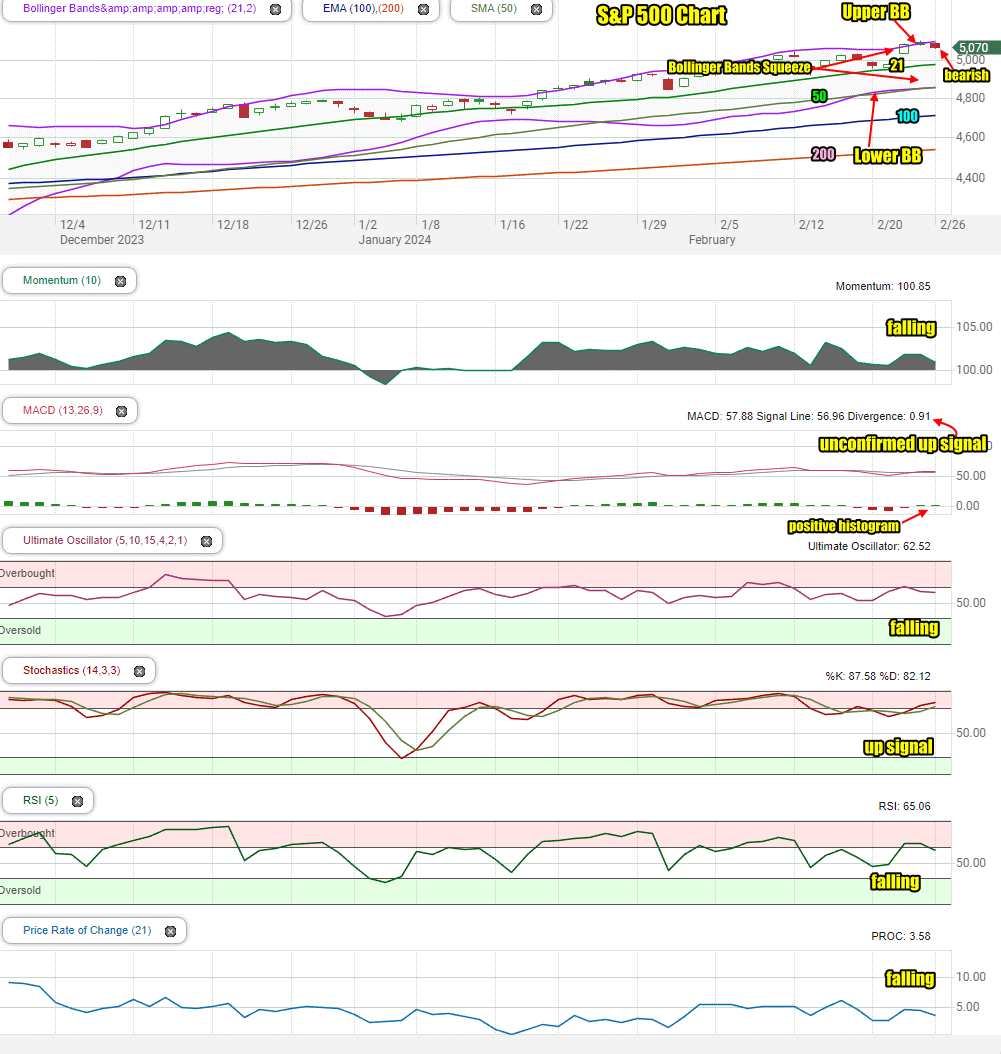
On Monday Feb 26 stocks traded primarily sideways but kept a slight bearish bias despite a new but unconfirmed MACD up signal. The sideways market movement on Monday kept the MACD from confirming Friday’s up signal.
The S&P closed down 19 points at 5069 on light volume of 3.8 billion shares traded. 57% of all stocks on New York were moving lower.
The NASDAQ ended the day down 20 points to close at 15,976. Trading volume was steady at 5.5 billion shares with 50% of all stocks rising.
Monday was the second straight day for the SPX to trade with light volume.
Let’s review Monday’s closing technical indicators to see what we should expect for Tue Feb 27 2024.
Stock Market Outlook: SPX Closing Chart For Mon Feb 26 2024
The index closed just below the Upper Bollinger Band on Monday. This is bullish.
The closing candlestick is bearish for Tuesday with a chance for a further lower close being signaled. At the same time, often this candlestick is followed by an up day.
The 21 day moving average is moving higher which is bullish. It is at 4975 on the SPX.
The 50 day moving average is rising and at 4850 which is bullish.
The 100 and 200 day moving averages are climbing which is bullish. The 200 day is at 4530 on the SPX which is bullish.
The Bollinger Bands are still in a Bollinger Bands Squeeze and appear to be signaling a move higher out of the squeeze.
The S&P chart is more bullish than bearish for Tue Feb 27 2024.
Stock Market Outlook review of Mon Feb 26 2024
Stock Market Outlook: Technical Indicators Review
Momentum: Momentum is falling and positive.
|
MACD Histogram: MACD (Moving Averages Convergence / Divergence) issued a down signal on Fri Feb 16 2024. On Fri Feb 23 2024 a new unconfirmed up signal was generated. On Monday the up signal was not confirmed.
|
Ultimate Oscillator: The Ultimate Oscillator is falling and positive.
|
Slow Stochastic: The Slow Stochastic has an up signal in place and is entering overbought.
|
Relative Strength Index: The RSI signal is falling and positive. It is overbought.
|
Rate of Change: The rate of change signal is falling and signaling a lower close is likely for Tuesday.
|
Stock Market Outlook: Support and Resistance Levels |
| 5100 is resistance |
| 5090 is resistance |
| 5075 is resistance |
| 5050 is resistance |
| 5025 is resistance |
| 5010 is resistance |
| 5000 is resistance |
| 4990 is resistance |
| 4975 is resistance |
| 4950 is resistance |
| 4925 is resistance |
| 4915 is resistance |
| 4900 is support |
| 4875 is support |
| 4850 is support |
| 4825 is support |
| 4815 is support |
| 4800 is support |
| 4780 is support |
| 4750 is support |
Stock Market Outlook for Tue Feb 27 2024
For Tuesday the technical indicators are still signaling more choppy action as stocks continue to consolidate recent gains. There is a strong likelihood of a lower close with a number of dips probable on Tuesday.
Three economic reports are released Tuesday morning. They may weigh slightly on stocks if the anticipated numbers (see below for Tuesday) are not met.
Potential Economic and Political Market Moving Events
This is a busy week for reports including durable goods order on Tuesday, retail and wholesale inventories on Wednesday, PCE on Thursday and manufacturing on Friday.
Monday:
10:00 New home sales are expected to dip but instead they rose by 10,000 to 661,000
Tuesday:
8:30 Durable goods orders are expected to drop to -5.0% from 0.0%
9:00 Case-Shiller home price index is expected to be unchanged
10:00 Consumer confidence for February is expected to rise to 115 from 114.8