

Monday saw markets deal with being overbought and flirting with new all-time highs. The S&P traded in a tight range and closed down just 7 points at 3691.
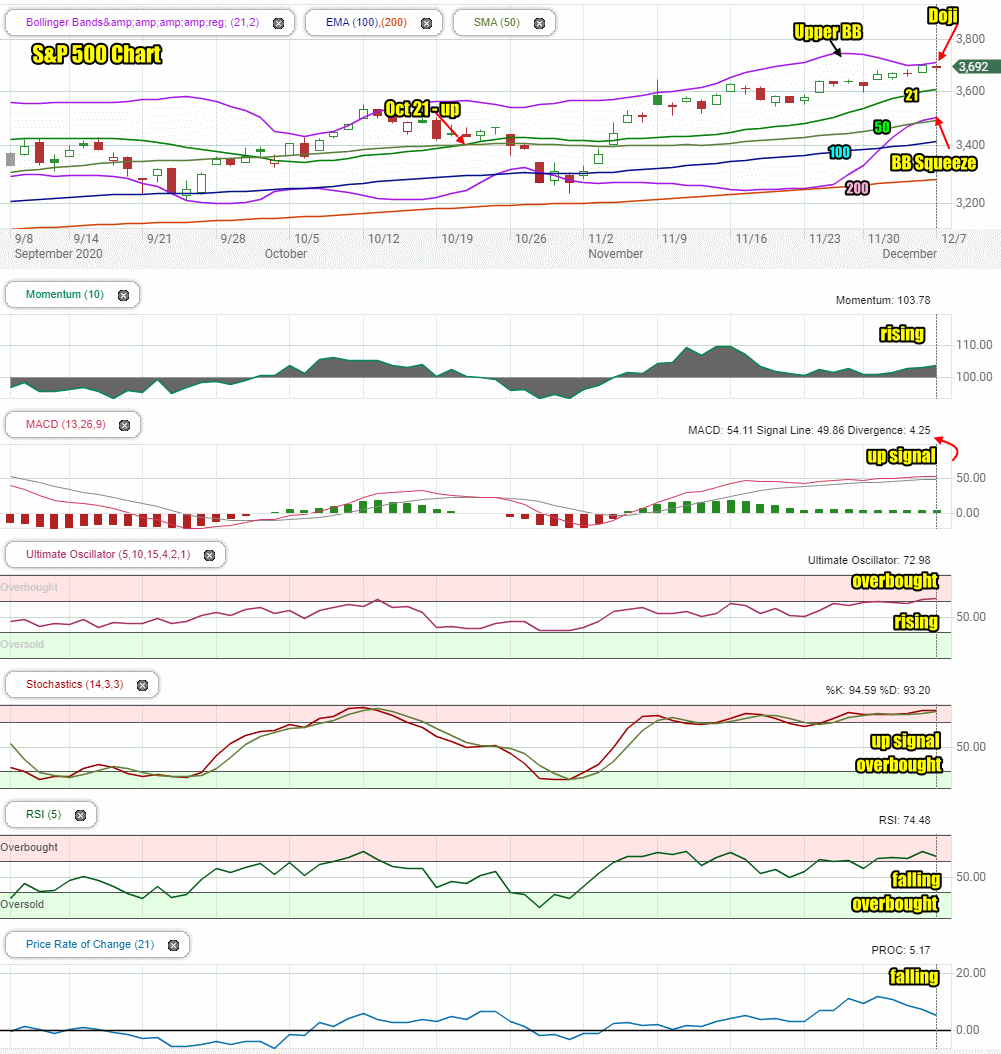
Stock Market Outlook Chart Comments At The Close on Mon Dec 7 2020
Monday saw the index close above 3600 for the 9th straight trading day almost a two week period. The closing candlestick is what is known as a Doji. Often this candlestick signals a potential change for the following day. Since the day before the Doji was higher, normally it means the day after the Doji will be lower.
Meanwhile the index has entered a Bollinger Bands Squeeze. It’s a bit early to predict which direction the index will move out of the squeeze but the Doji closing candlestick is not unusual to see at the start of a squeeze.
The 21 day, 50 day, 100 day and 200 day moving averages are all rising, a bullish sign. The 21 day is rising rapidly as well and moved above 3600 on Monday. Often the speed of the climb for the 21 day indicates a dip should be expected shortly as the index is overbought. The up signal from Oct 21 is still in play, and the chart remains bullish despite the closing candlestick, concerns over the rise of the 21 day and the Bollinger Bands Squeeze.
Stock Market Outlook review of Mon Dec 7 2020
Stock Market Outlook: Technical Indicators Review:
Momentum: Momentum is rising and positive.
- Settings: For momentum I use a 10 period when studying market direction.
MACD Histogram: MACD (Moving Averages Convergence / Divergence) issued an up signal on Nov 5. The up signal on Monday was slightly weaker.
- Settings: For MACD Histogram, I am using the Fast Points set at 13, Slow Points at 26 and Smoothing at 9.
Ultimate Oscillator: The Ultimate Oscillator is rising and overbought.
- Settings: The Ultimate Oscillator settings are: Period 1 is 5, Period 2 is 10, Period 3 is 15, Factor 1 is 4, Factor 2 is 2 and Factor 3 is 1. These are not the default settings but are the settings I use with the S&P 500 chart set for 1 to 3 months.
Slow Stochastic: The Slow Stochastic has an up signal in place. It is overbought.
Settings: For the Slow Stochastic I use the K period of 14 and D period of 3. The Slow Stochastic tries to predict the market direction further out than just one day.
Relative Strength Index: The RSI signal is falling and overbought.
- Settings: The relative strength index is set for a period of 5 which gives it 5 days of market movement to monitor. It is often the first indicator to show an overbought or oversold signal.
Rate of Change: The rate of change signal is falling for a fourth straight day.
- Settings: Rate Of Change is set for a 21 period. This indicator looks back 21 days and compares price action from the past to the present. With the Rate Of Change, prices are rising when signals are positive. Conversely, prices are falling when signals are negative. As an advance rises the Rate Of Change signal should also rise higher, otherwise the rally is suspect. A decline should see the Rate Of Change fall into negative signals. The more negative the signals the stronger the decline.
Support and Resistance Levels To Be Aware Of:
3600 is resistance
3550 is support
3500 is support
3450 is support
3400 is support
3375 is support
3300 is support
3275 is support
3200 is support
3150 is support
3050 is support
3000 is support
Stock Market Outlook for Tomorrow – Tue Dec 8 2020
For Tuesday the index will start the day flat to slightly lower as the overbought condition still exists.
The Rate Of Change is advising that no matter what happens on Tuesday, investors shouldn’t expect a big price swing up or down in the index.
The start of the Bollinger Bands Squeeze is difficult to predict where the index may head next but the underlying trend is extremely bullish and momentum remains solidly bullish. That could mean the squeeze may end with the index push higher.
For Tuesday we could see a repeat of Monday, with dips that could be deeper than expected but the close could still be higher as the index struggles with the overbought condition. 3700 though should be broken shortly.
Stock Market Outlook Archives
Stock Market Outlook For Wed May 6 2026 – Choppy But Higher Still

Morning Investing Strategy Notes for Tue May 5 2026

Stock Market Outlook For Tue May 5 2026 – Overbought and Lower

Morning Investing Strategy Notes for Mon May 4 2026
Stock Market Outlook For Mon May 4 2026 – Dips Likely With Possible Lower Close

Morning Investing Strategy Notes for Fri May 1 2026
Stock Market Outlook For Fri May 1 2026 – Overbought But Higher

Morning Investing Strategy Notes for Thu Apr 30 2026
Stock Market Outlook For Thu Apr 30 2026 – Dips Likely Possible Lower Close
Morning Investing Strategy Notes for Wed Apr 29 2026
Stock Market Outlook For Wed Apr 29 2026 – Choppy But Higher Ahead Of More Earnings

Morning Investing Strategy Notes for Tue Apr 28 2026