

Stocks on Monday spent the day primarily in sell mode. Volumes were low however as most investors sat on the sidelines waiting for the Fed’s announcement on interest rates due out Wednesday afternoon. The S&P lost 43 points with 20 of those points lost in the final hour of trading. The index closed at 4668.97, back below the 4700 level. The NASDAQ lost 217 points to close at 15,413.
Let’s review the technical indicators at the close of trading on Monday to see what to expect for Tuesday.
Stock Market Outlook Chart Comments At The Close on Mon Dec 13 2021
The closing candlestick on Monday was once again bearish. The index closed down at the 21 day moving average which is bearish but at the same time, it signals a bounce attempt is likely off the 21 day. For Tuesday though any bounce off the 21 day looks poor.
The 21 day moving average is still turning higher which is bullish. The other remaining major moving averages, namely the 50, 100 and 200 day are still climbing. This is bullish.
The Bollinger Bands Squeeze is over. The Lower Bollinger Band is falling and the Upper Bollinger Band is starting to rise. These are bullish signals.
Overall the chart is more bullish than bearish for Tuesday.
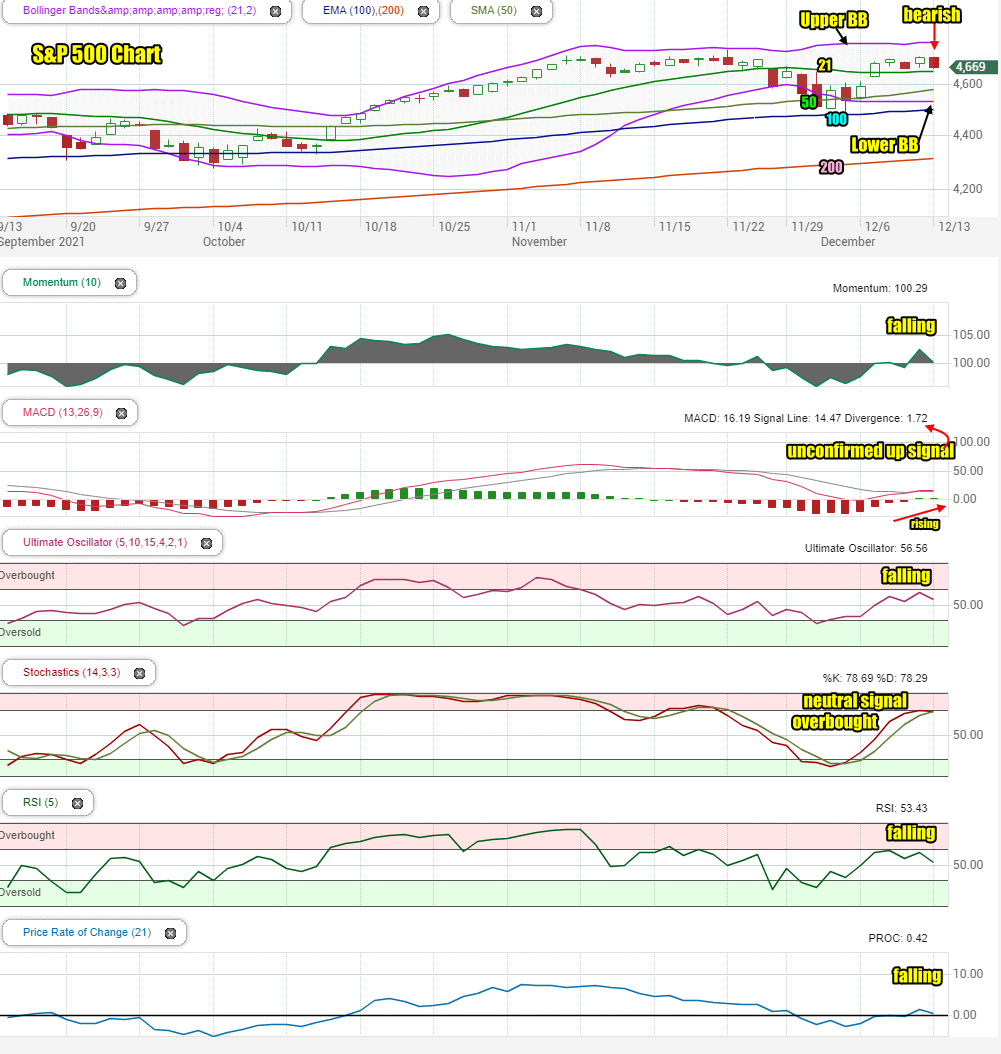
Stock Market Outlook review of Mon Dec 13 2021
Stock Market Outlook: Technical Indicators Review:
Momentum: Momentum is falling and positive.
- Settings: For momentum I use a 10 period when studying market direction.
MACD Histogram: MACD (Moving Averages Convergence / Divergence) issued an confirmed down signal on Wed Nov 17 2021 . On Monday, Friday’s up signal was still not confirmed. The MACD histogram though, is rising and starting to turn positive.
- Settings: For MACD Histogram, I am using the Fast Points set at 13, Slow Points at 26 and Smoothing at 9.
Ultimate Oscillator: The Ultimate Oscillator is back falling.
- Settings: The Ultimate Oscillator settings are: Period 1 is 5, Period 2 is 10, Period 3 is 15, Factor 1 is 4, Factor 2 is 2 and Factor 3 is 1. These are not the default settings but are the settings I use with the S&P 500 chart set for 1 to 3 months.
Slow Stochastic: The Slow Stochastic has a very weak up signal for Tuesday.
Settings: For the Slow Stochastic I use the K period of 14 and D period of 3. The Slow Stochastic tries to predict the market direction further out than just one day.
Relative Strength Index: The RSI signal is falling.
- Settings: The relative strength index is set for a period of 5 which gives it 5 days of market movement to monitor. It is often the first indicator to show an overbought or oversold signal.
Rate of Change: The rate of change signal is also falling.
- Settings: Rate Of Change is set for a 21 period. This indicator looks back 21 days and compares price action from the past to the present. With the Rate Of Change, prices are rising when signals are positive. Conversely, prices are falling when signals are negative. As an advance rises the Rate Of Change signal should also rise higher, otherwise the rally is suspect. A decline should see the Rate Of Change fall into negative signals. The more negative the signals the stronger the decline.
Support and Resistance Levels To Be Aware Of:
4725 is resistance
4700 is resistance
4655 is light support.
4600 is good support
4550 is light support
4525 is light support
4500 is support
Stock Market Outlook for Tomorrow – Tue Dec 14 2021
For Tuesday, the signals are poor to start the day. There is a chance of a bounce early morning but with all eyes on the Fed’s decision to be released Wednesday, the chance of a sustainable bounce is very limited.
The technical indicators are primarily pointing down for Tuesday. With this much strength to the downside the likelihood of a bounce grows stronger but a lot of investors will not place capital at risk ahead of the Fed’s decision due out tomorrow. For that reason the outlook for Tuesday is all about the Fed’s decision on interest rates. Tuesday will be weaker with a good chance of a second negative close.
Stock Market Outlook Archives
Stock Market Outlook For Wed May 6 2026 – Choppy But Higher Still

Morning Investing Strategy Notes for Tue May 5 2026

Stock Market Outlook For Tue May 5 2026 – Overbought and Lower

Morning Investing Strategy Notes for Mon May 4 2026
Stock Market Outlook For Mon May 4 2026 – Dips Likely With Possible Lower Close

Morning Investing Strategy Notes for Fri May 1 2026
Stock Market Outlook For Fri May 1 2026 – Overbought But Higher

Morning Investing Strategy Notes for Thu Apr 30 2026
Stock Market Outlook For Thu Apr 30 2026 – Dips Likely Possible Lower Close
Morning Investing Strategy Notes for Wed Apr 29 2026
Stock Market Outlook For Wed Apr 29 2026 – Choppy But Higher Ahead Of More Earnings

Morning Investing Strategy Notes for Tue Apr 28 2026