
 Prior Trading Day Summary
On Mon Aug 4 2025 investors decided that Friday’s sell-off was overdone. They bought back into most of the names that had fallen on Friday.
The day ended with the SPX up 92 points to 6329 just 10 points below where the SPX was on Thursday at the close.
The NASDAQ rose 403 points to end the day at 21053, which was 69 points below where the NASDAQ was on Thursday at the close.
On Monday volume was poor though which could signal some caution heading further into this week.
Lets review the closing technical indicators from Mon Aug 4 2025 to see what they predict for Tue Aug 5 2025.
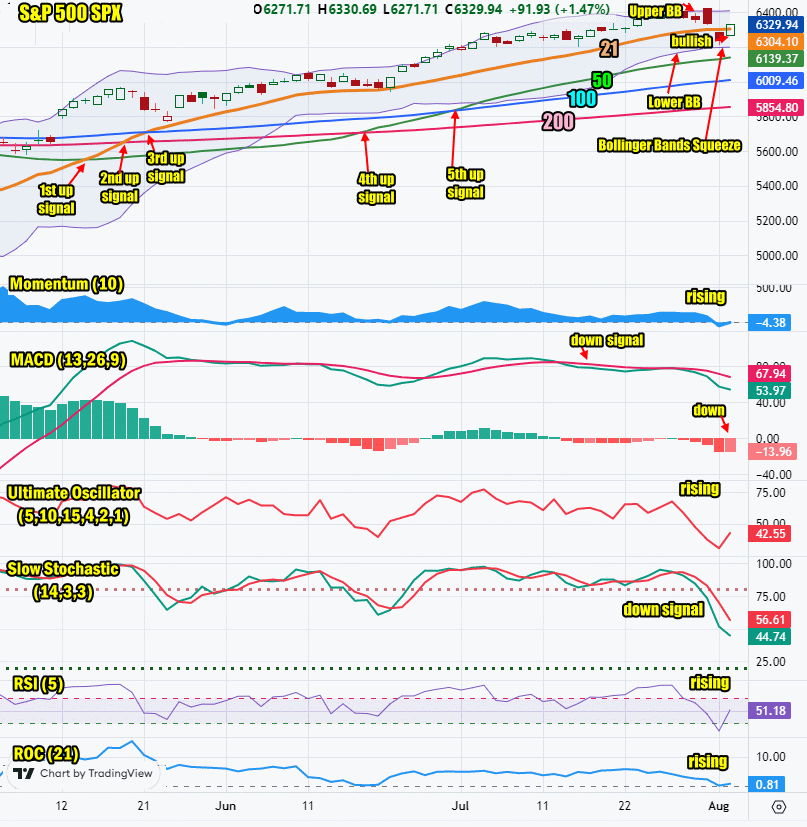
Stock Market Outlook: SPX Closing Chart For Mon Aug 4 2025
The index closed below the Upper Bollinger Band but above the 21 day moving average. This is bullish.
The closing candlestick is bullish for Tuesday.
The 21 day moving average stalled on Friday and closed unchanged at 6329 which is bearish.
The 50 day moving average is rising and closed at 6139 which is bullish.
The 100 day moving average is rising and closed at 6009 which is bullish.
The 200 day moving average is rising and closed at 5854 which is bullish.
The Lower Bollinger Band is turning sideways which is negative but it is above the 50 day moving average. The Upper Bollinger Band is moving higher which is bullish. The Bollinger Bands Squeeze is still in play but stocks look set to pullback out of the latest squeeze.
The SPX chart is looking stronger for Tuesday but there are still a few bearish signals to be aware of.
SPX Stock Market Outlook review of Mon Aug 4 2025
Stock Market Outlook: Technical Indicators Review
Momentum: Momentum is rising and negative.
|
MACD Histogram: MACD (Moving Averages Convergence / Divergence) issued a down signal on Tue Jul 15. On Mon Aug 4 2025 the down signal stayed unchanged.
|
Ultimate Oscillator: The Ultimate Oscillator is rising.
|
Slow Stochastic: The Slow Stochastic has a down signal in place.
|
Relative Strength Index: The RSI signal is rising.
|
| Rate of Change: The rate of change signal is rising signaling a higher close is expected for Tuesday. Settings: Rate Of Change is set for a 21 period. This indicator looks back 21 days and compares price action from the past to the present. With the Rate Of Change, prices are rising when signals are positive. Conversely, prices are falling when signals are negative. As an advance rises, the Rate Of Change signal should also rise higher, otherwise the rally is suspect. A decline should see the Rate Of Change fall into negative signals. The more negative the signals the stronger the decline. |
Stock Market Outlook: Support and Resistance Levels |
| 6400 is resistance |
| 6390 is resistance |
| 6365 is resistance |
| 6350 is resistance |
| 6325 is resistance |
| 6300 is resistance |
| 6250 is resistance |
| 6225 is resistance |
| 6200 is resistance |
| 6175 is resistance |
| 6150 is resistance |
| 6125 is resistance |
| 6100 is support |
| 6075 is support |
| 6050 is support |
| 6025 is support |
| 6000 is support |
| 5990 is support |
| 5975 is support |
| 5950 is support |
| 5925 is support |
| 5900 is support |
Stock Market Outlook for Tue Aug 5 2025
For Tue Aug 5 2025 the technical indicators have switched from pointing lower to pointing higher, following Monday’s recovery rally. Trading volume though was low and that makes the bounce on Monday a bit suspect that some of the rally could be returned this week.
For Monday I expect a higher open and then dips in the morning. A higher close however is expected.
Potential Economic and Political Market Moving Events
Monday:
10:00 Factory orders came in at -4.8% slightly better than estimates.
Tuesday:
8:30 Trade deficit is expected to rise to -$61.0 billion
9:45 S&P final services PMI is estimated at 50.9
10:00 ISM services is expect to climb to 51.1% from 50.8% prior