
On Monday stocks continued their advance. In particular the components of the Dow pushed that index higher by 327 points to close at 33,601.
The S&P rose 15 points to end the day at 4124 while the NASDAQ dipped 32 points to close at 12,189.
ISM Manufacturing showed a 1.4% dip to 46.3% which surprised many analysts and investors. Construction spending also slowed. But overall indicators continue to suggest there is more upside ahead for stocks.
Let’s review the closing technical indicators from Mon Apr 3 2023 to see what we should expect for Tue Apr 4 2023.
Stock Market Outlook Chart Comments At The Close on Mon Apr 3 2023
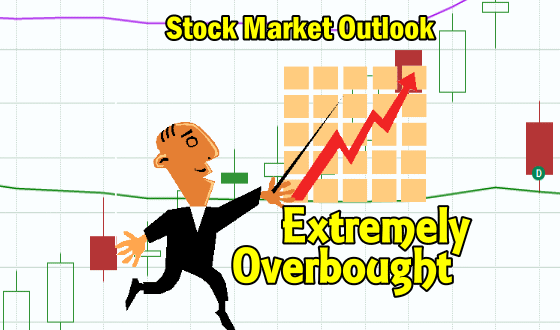
The index closed with a bullish candlestick for Tuesday and above all the major moving averages. The closing candlestick is signaling the market is now extremely overbought and will dip again on Tuesday but still push for a higher close.
The Upper Bollinger Band is turning up and the Lower Bollinger Band is turning down. Both are bullish signals.
The 200 day moving average is at 4000. The 21 day is turning back up and will cross above the 100 day moving average on Tuesday for another up signal.
The 50 day continues above the 200 day which is bullish. The 100 day is moving sideways above the 21 day which is the only bearish signal from the moving averages.
At present there are 4 down signals in place since April 24 and 3 up signals since Jan 13.
The chart is more bullish for Tuesday than bearish but investors should be ready for dips, some of which could be deeper than expected.

Stock Market Outlook review of Mon Apr 3 2023
Stock Market Outlook: Technical Indicators Review:
Momentum: Momentum is unchanged and positive.
- Settings: For momentum I use a 10 period when studying market direction.
MACD Histogram: MACD (Moving Averages Convergence / Divergence) up signal from Mar 21 gained more strength. The histogram is also positive.
- Settings: For MACD Histogram, I am using the Fast Points set at 13, Slow Points at 26 and Smoothing at 9.
Ultimate Oscillator: The Ultimate Oscillator is rising and positive. It is signaling overbought.
- Settings: The Ultimate Oscillator settings are: Period 1 is 5, Period 2 is 10, Period 3 is 15, Factor 1 is 4, Factor 2 is 2 and Factor 3 is 1. These are not the default settings but are the settings I use with the S&P 500 chart set for 1 to 3 months.
Slow Stochastic: The Slow Stochastic has an up signal in place. It is also signaling overbought.
Settings: For the Slow Stochastic I use the K period of 14 and D period of 3. The Slow Stochastic tries to predict the market direction further out than just one day.
Relative Strength Index: The RSI signal is rising and positive. It is also overbought.
- Settings: The relative strength index is set for a period of 5 which gives it 5 days of market movement to monitor. It is often the first indicator to show an overbought or oversold signal.
Rate of Change: The rate of change signal is falling and signaling overbought.
- Settings: Rate Of Change is set for a 21 period. This indicator looks back 21 days and compares price action from the past to the present. With the Rate Of Change, prices are rising when signals are positive. Conversely, prices are falling when signals are negative. As an advance rises the Rate Of Change signal should also rise higher, otherwise the rally is suspect. A decline should see the Rate Of Change fall into negative signals. The more negative the signals the stronger the decline.
Support and Resistance Levels To Be Aware Of:
4100 is resistance
4090 is resistance
4075 is resistance
4050 is resistance
4030 is resistance
4025 is resistance
4000 is support
3975 is light support
3965 is light support
3950 is good support
3930 is light support
3900 is good support
3870 is light support
3850 is good support
3825 is light support
3810 is light support
3800 is good support
3775 is good support
Stock Market Outlook for Tue Apr 4 2023
The technical indicators are showin further signs of being extremely overbought. Most are slowing their advance as at risk of stalling. Momentum and Rate Of Change are clearly showing weakness is developing.
This is a short week due to the Easter holiday weekend coming up. On Friday, the March non-farm payroll numbers are still being released. The effect of those number won’t be known until next week.
For Tuesday watch for dips with deeper slips likely. I am taking advantage of dips to setup trades.
Potential Economic and Political Market Moving Events
The biggest market moving event is the March non-farm payroll numbers due out Friday. The economic reports on Monday surprised many analysts with weakness. Personally I did not think there was any weakness in the numbers to cause any investor to not sleep nights..
Tuesday:
10:00 Factory orders
10:00 Job 0penings