

The collapse of the May oil contracts on Monday to negative indicates just how bad the oil glut is. Stocks managed to hold up on Monday although they closed negative. However news this that North Korea’s dictator Kim Jong Un is gravely ill has futures tumbling as this could introduce a new instability in the Korean peninsula and Asia. Overall, the market on Tuesday looks set to move lower. Let’s take a look.
Stock Market Outlook Chart Comments At The Close on Mon Apr 20 2020
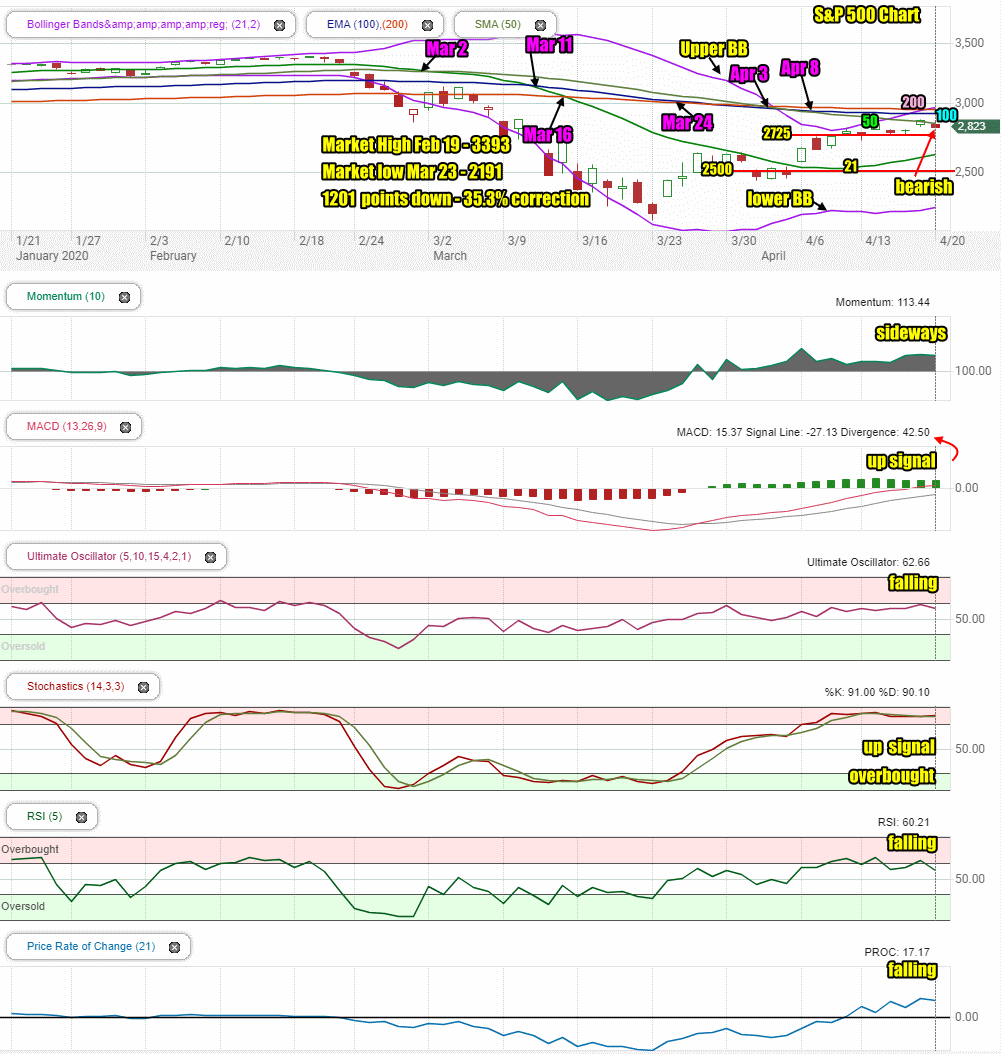
The SPX chart continues to be bearish with 6 sell signals in the chart. On Monday the S&P fell back but is still trying to hold above 2800 and to the 50 day moving average. The 2800 has been a tough valuation to break through and hold. Last night I discussed how the S&P would dip below 2800 this week. It looks like Tuesday could see the first dip below it.
The 200 day moving average is now leading the market, which is typical in a bear market. It is followed by the 100 day and the 50 day. The 21 day is turning back up which if it could continue to climb would be good for the bulls, but for now, this looks like a bounce in that moving average.
The closing candlestick on Monday is bearish for Tuesday.
Stock Market Outlook review of Mon Apr 20 2020
Stock Market Outlook: Technical Indicators Review:
Momentum: Momentum is moving sideways and still positive.
- Settings: For momentum I use a 10 period when studying market direction.
MACD Histogram: MACD (Moving Averages Convergence / Divergence) issued an up signal on Thursday March 26. The up signal was strong again on Monday.
- Settings: For MACD Histogram, I am using the Fast Points set at 13, Slow Points at 26 and Smoothing at 9.
Ultimate Oscillator: The Ultimate Oscillator signal is falling.
- Settings: The Ultimate Oscillator settings are: Period 1 is 5, Period 2 is 10, Period 3 is 15, Factor 1 is 4, Factor 2 is 2 and Factor 3 is 1. These are not the default settings but are the settings I use with the S&P 500 chart set for 1 to 3 months.
Slow Stochastic: The Slow Stochastic has an up signal in place and is signaling overbought.
- Settings: For the Slow Stochastic I use the K period of 14 and D period of 3. The Slow Stochastic tries to predict the market direction further out than just one day.
Relative Strength Index: The RSI signal is falling.
- Settings: The relative strength index is set for a period of 5 which gives it 5 days of market movement to monitor. It is often the first indicator to show an overbought or oversold signal.
Rate of Change: The rate of change signal is falling signaling lower prices are ahead.
- Settings: Rate Of Change is set for a 21 period. This indicator looks back 21 days and compares price action from the past to the present. With the Rate Of Change, prices are rising when signals are positive. Conversely, prices are falling when signals are negative. As an advance rises the Rate Of Change signal should also rise higher, otherwise the rally is suspect. A decline should see the Rate Of Change fall into negative signals. The more negative the signals the stronger the decline.
Support and Resistance Levels To Be Aware Of:
2900 is resistance
2860 is resistance
2840 is resistance
2800 is resistance
2700 is light support and marked a drop of 20.4%.
2675 is light resistant
2650 is light support
2625 is light support
2600 is support
2550 is light support
2500 was good support and marked a correction of 26.3%
2344 is the next level of support and marks a 30.9% correction.
2100 is light support
2000 is good support and marks a drop of 1393 points for a 41% correction. More analysts are jumping onto this level as where the correction is heading.
Stock Market Outlook for Tomorrow – Tue Apr 21 2020
For Tuesday stocks are set to break below 2800. This doesn’t signal an end to the rally, but it does signal that the best bounce is over for now. The decline in oil prices and oil futures will continue to hit stock markets hard on Tuesday.
Technical indicators have turned back down with 3 indicators now falling, one moving sideways and two with up signals in place but unable to build further strength on those up signals.
The index will experience further weakness on Tuesday and slip lower as it looks to find where buyers are. Today buyers were sitting just above 2800. On Tuesday they will be below 2800 and many may move still lower, down to 2750 or even 2725.
Overall the index will close below 2800 on Tuesday.
Stock Market Outlook Archives
Stock Market Outlook For Wed May 6 2026 – Choppy But Higher Still

Morning Investing Strategy Notes for Tue May 5 2026

Stock Market Outlook For Tue May 5 2026 – Overbought and Lower

Morning Investing Strategy Notes for Mon May 4 2026
Stock Market Outlook For Mon May 4 2026 – Dips Likely With Possible Lower Close

Morning Investing Strategy Notes for Fri May 1 2026
Stock Market Outlook For Fri May 1 2026 – Overbought But Higher

Morning Investing Strategy Notes for Thu Apr 30 2026
Stock Market Outlook For Thu Apr 30 2026 – Dips Likely Possible Lower Close
Morning Investing Strategy Notes for Wed Apr 29 2026
Stock Market Outlook For Wed Apr 29 2026 – Choppy But Higher Ahead Of More Earnings

Morning Investing Strategy Notes for Tue Apr 28 2026