
 Economic numbers from ADP beat estimates showing August as the strongest month for job creations in 5 months and GDP numbers pointed to 3% growth rate for the year. All of this helped investors shrug off worries over North Korea. Investors continued the rally from Tuesday and pushed indexes higher into the close on Wednesday.
S&P Index Close
The S&P index ended up 11.29 to 2457.59.
Dow Jones Index Close
The Dow Jones ended up 27.06 to 21,892.43.
NASDAQ Index Close
The NASDAQ closed up 66.42 to 6368.31.
Stock Market Outlook
Stock Market Outlook review of Wed Aug 30 2017
Chart Comments At The Close:
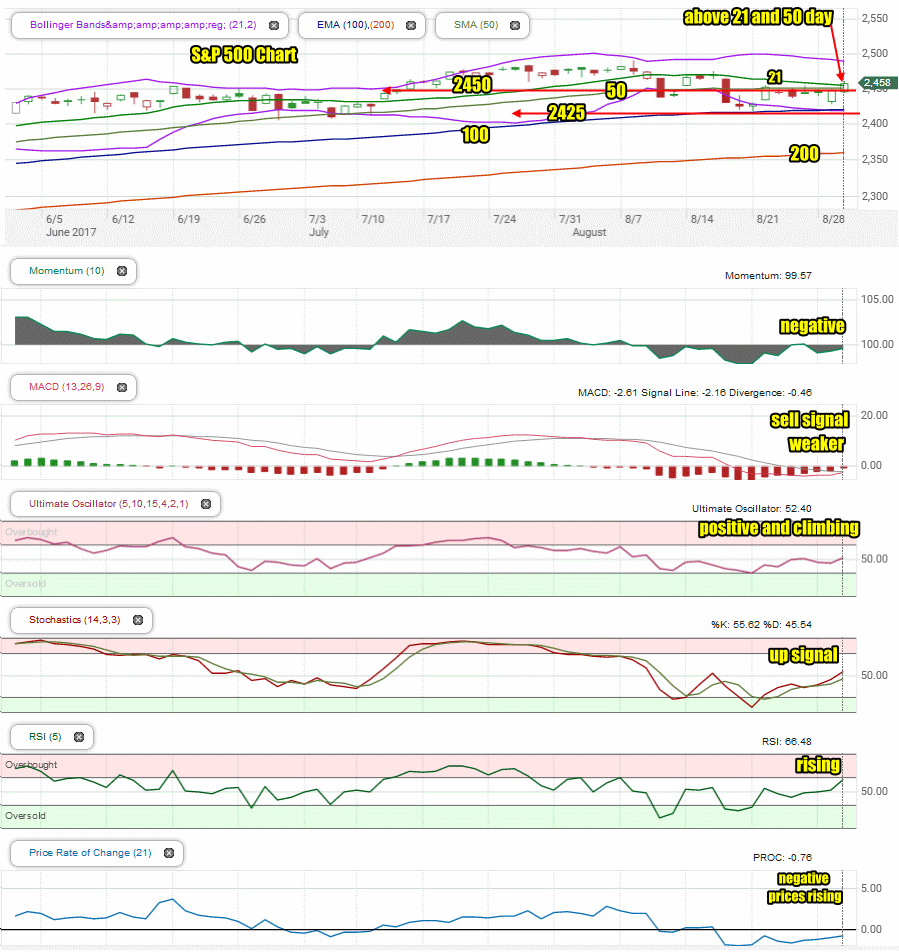
The S&P on Wednesday moved above the 50 day and 21 day moving average which is bullish although a retest of either both or one of the moving averages on Thursday, probably in the morning is likely.
The closing candlestick is bullish.
The 21 day moving average is still falling but has not fallen below the 50 day moving average which is also bullish. The Upper Bollinger Band continues to slowly fall lower but it is not overly bearish.
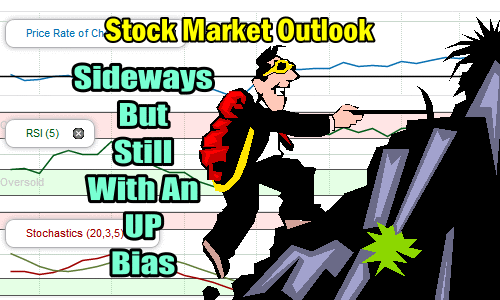
Overall the chart looks more like sideways than up or down.
Stock Market Outlook: Technical Indicators:
Momentum: For momentum I use a 10 period when studying market direction. Momentum is negative although it is starting to rise.
MACD Histogram: For MACD Histogram, I am using the Fast Points set at 13, Slow Points at 26 and Smoothing at 9. MACD (Moving Averages Convergence / Divergence) issued a sell signal on Aug 3. The sell signal lost more strength again on Wednesday and the MACD histogram is also rising. Both are ready to turn positive shortly if the S&P moves higher on Thursday.
Ultimate Oscillator: The Ultimate Oscillator settings are: Period 1 is 5, Period 2 is 10, Period 3 is 15, Factor 1 is 4, Factor 2 is 2 and Factor 3 is 1. These are not the default settings but are the settings I use with the S&P 500 chart set for 1 to 3 months. The Ultimate Oscillator is positive and rising.
Slow Stochastic: For the Slow Stochastic I use the K period of 14 and D period of 3. The Slow Stochastic tries to predict the market direction further out than just one day. The Slow Stochastic has an up signal still in place for Thursday.
Relative Strength Index: The relative strength index is set for a period of 5 which gives it 5 days of market movement to monitor. It often is the first indicator to show an overbought or oversold signal. The RSI signal is rising toward signaling overbought.
Rate of Change: Rate Of Change is set for a 21 period. This indicator looks back 21 days and compares price action from the past to the present. The rate of change signal is still negative and but is continuing to indicate that prices may rise.
Support Levels To Be Aware Of:
The market had developed light support at 2450 and good support at 2425. There is also light support at 2400, 2380, 2350 and 2300.
The market should retest 2450 on Thursday.
Stock Market Outlook for Tomorrow – Thursday Aug 31 2017
Technically there continue to be more bullish signals again at the close on Wednesday. Thursday morning may see the S&P retest the 21 or 50 day moving average and a retest of 2450 is very possible.
However for now, a retest is likely a chance to setup more trades.
For Thursday we should see another positive close for the markets but a lot of sideways action should dominate as investors wait for Friday’s non-farm payroll numbers.
Stay FullyInformed With Email Updates
Market Direction Internal Links
Profiting From Understanding Market Direction (Articles Index)
Understanding Short-Term Signals
Market Direction Portfolio Trades (Members)
Market Direction External Links
IWM ETF Russell 2000 Fund Info
Market Direction SPY ETF 500 Fund Info