
Wednesday saw a terrible bounce attempt with no conviction and even less interest from buyers. Tuesday’s collapse was severe which should have resulted in a bigger bounce attempt. Instead the S&P squeaked out a 13 point gain. After a 178 point plunge, we should have seen a much stronger bounce attempt. This is telling us there is more downside ahead.
The NASDAQ which lost 633 points on Tuesday, gained just 86 points. On both indexes, the majority of big caps struggled to remain positive.
Let’s review the closing technical indicators from Wednesday’s lackluster bounce attempt, to see what we should expect for Thu Sep 15 2022.
Stock Market Outlook Chart Comments At The Close on Wed Sep 14 2022
There are no changes in the SPX chart except for further bearish signals.
The 21 day moving average is continuing to fall after issuing a new down signal on Sep 13. This is a third down signal, as the market was unable to overcome the sell signals from April 24 and April 26 earlier this year.
The closing candlestick is bearish and no longer points to a potential bounce. It indicates Thursday will be lower.
The candlestick closed back below all moving averages which is bearish. It ended the day well below the 50 day moving average.
The Bollinger Bands are indicating further downside lies ahead. The Upper Bollinger Band and Lower Bollinger Band are turning lower signaling stocks have further to fall. There is a chance for another Bollinger Bands Squeeze by next week which could send stocks still lower.
The 21 day moving average is falling further away from the 200 day and could fall below the 50 day as the rest of this week plays out.
All the moving averages are now falling which is bearish.
The first up signal since April was released Tuesday Aug 2 when the 21 day moving average crossed above the 50 day moving average.
The second up signal from Wed Aug 16 was wiped out Tuesday when the 21 day moved back below the 100 day after failing to reach the 200 day.
There are now 3 down signals in place and one up signal that will be wiped out shortly.
The chart is almost 100% bearish for Thursday.

Stock Market Outlook review of Wed Sep 14 2022
Stock Market Outlook: Technical Indicators Review:
Momentum: Momentum is rising but negative.
- Settings: For momentum I use a 10 period when studying market direction.
MACD Histogram: MACD (Moving Averages Convergence / Divergence) issued a down signal on Monday Aug 22. On Wednesday the down signal gained strength. The histogram also gained strength signaling more downside is ahead for stocks.
- Settings: For MACD Histogram, I am using the Fast Points set at 13, Slow Points at 26 and Smoothing at 9.
Ultimate Oscillator: The Ultimate Oscillator is falling and negative.
- Settings: The Ultimate Oscillator settings are: Period 1 is 5, Period 2 is 10, Period 3 is 15, Factor 1 is 4, Factor 2 is 2 and Factor 3 is 1. These are not the default settings but are the settings I use with the S&P 500 chart set for 1 to 3 months.
Slow Stochastic: The Slow Stochastic has a down signal in place and is not oversold.
Settings: For the Slow Stochastic I use the K period of 14 and D period of 3. The Slow Stochastic tries to predict the market direction further out than just one day.
Relative Strength Index: The RSI signal is trying to rise and remains near oversold readings.
- Settings: The relative strength index is set for a period of 5 which gives it 5 days of market movement to monitor. It is often the first indicator to show an overbought or oversold signal.
Rate of Change: The rate of change signal is still lower and indicates the index has further to fall.
- Settings: Rate Of Change is set for a 21 period. This indicator looks back 21 days and compares price action from the past to the present. With the Rate Of Change, prices are rising when signals are positive. Conversely, prices are falling when signals are negative. As an advance rises the Rate Of Change signal should also rise higher, otherwise the rally is suspect. A decline should see the Rate Of Change fall into negative signals. The more negative the signals the stronger the decline.
Support and Resistance Levels To Be Aware Of:
4250 is stronger resistance
4220 is light resistance
4200 is strong resistance
4150 is light resistance
4100 is light resistance
4050 is light resistance
4025 is light resistance
4000 is light resistance
3975 is light support and is a decline of 17.5%
3950 is light support
3925 is light support
3900 is strong support
3875 is light support
3850 is good support
3825 is light support
3810 is good support
3800 is light support
Stock Market Outlook for Tomorrow – Thu Sep 15 2022
For Thursday the technical indicators are bearish and indicate there is more downside ahead.
We should have seen a better bounce attempt on Wednesday. When that failed and buying volume stayed away from stocks, it signaled the index will move lower before a serious bounce gets underway.
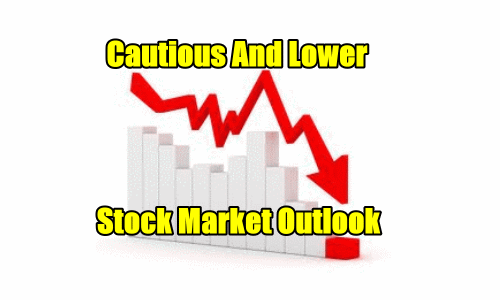
I believe we will see the SPX below 3900 on Thursday. I traded the SPY ETF Hedge Portfolio primarily to the downside on Wednesday and I will be doing the same on Thursday. The outlook is cautious and lower for Thursday.
Potential Market Moving Events
On Thursday we get a slew of reports that should give some further clue as to the extent of inflation and likelihood of a slowing economy.
Wednesday:
8:30 On Wednesday the Producer Price Index (final demand) is expected to be negative 0.1%. It met expectations.
Thursday:
8:30 Weekly Initial Unemployment Insurance Claims are expected to come in at 225,000. A higher number would support those who claim the economy is slowing.
8:30 Retails Sales are expected to show no change from July.
8:30 Philadelphia Fed Manufacturing Index is expected to come in 2.3 versus 6.2 in July.
8:30 Empire State Manufacturing Index is expected to come in at minus 13.8, up from July’s minus 31.3
8:30 Import Price Index is expected to come in at minus 1.2% versus minus 1.4% from July.
9:15 Industrial Production Index is expected to come in at 0.0%.
Stock Market Outlook Archives
Stock Market Outlook For Wed May 6 2026 – Choppy But Higher Still

Morning Investing Strategy Notes for Tue May 5 2026

Stock Market Outlook For Tue May 5 2026 – Overbought and Lower

Morning Investing Strategy Notes for Mon May 4 2026
Stock Market Outlook For Mon May 4 2026 – Dips Likely With Possible Lower Close

Morning Investing Strategy Notes for Fri May 1 2026
Stock Market Outlook For Fri May 1 2026 – Overbought But Higher

Morning Investing Strategy Notes for Thu Apr 30 2026
Stock Market Outlook For Thu Apr 30 2026 – Dips Likely Possible Lower Close
Morning Investing Strategy Notes for Wed Apr 29 2026
Stock Market Outlook For Wed Apr 29 2026 – Choppy But Higher Ahead Of More Earnings

Morning Investing Strategy Notes for Tue Apr 28 2026