
Wednesday was a choppy session with a morning dip and an early afternoon dip but a higher close. The index ended up 16 points to 4536, just 9 points from the all-time high.
The NASDAQ closed down 7 points in a session that had better volume but couldn’t buck decliners like Netflix.
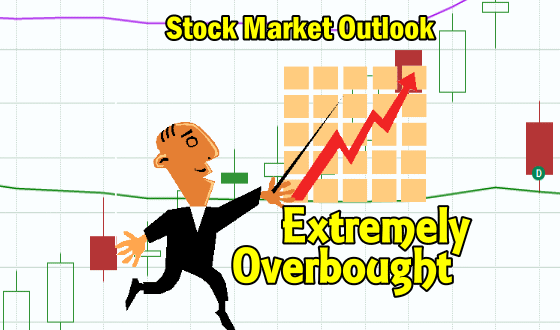
Let’s review the SPX closing technical readings from Wed Oct 20 2021 and see what to expect for Thu Oct 21 2021.
Stock Market Outlook Chart Comments At The Close on Wed Oct 20 2021
Wednesday saw the index close above the Upper Bollinger Band again. This is bullish but also a signal of an overbought market. The last 6 days have produced one of the best rallies in months for the S&P and left behind the downturn which started in early September. With many bears now rushing to snap up whatever stocks they feel are left to push higher, the market is becoming heated and the last three candlesticks are indicating to prepare for a down day or at least a flat day.
Wednesday’s closing candlestick is signaling a negative close is possible for Thursday.
The Upper Bollinger Band is rising and the Lower Bollinger Band is falling, both of which is bullish.
The 21 day moving average which fell below the 50 day last week, is turning higher and could cross above the 50 day shortly. This is bullish.
The 50 day is also turning higher as is the 100 and 200 day moving averages. This is bullish.
For Thursday the only bearish concern is the closing candlestick warning which is not pointing to a big down day of any kind. Instead it is signaling overbought, time for a breather to consolidate some of the gains.

Stock Market Outlook review of Wed Oct 20 2021
Stock Market Outlook: Technical Indicators Review:
Momentum: Momentum is strong and trending sideways or unchanged but positive.
- Settings: For momentum I use a 10 period when studying market direction.
MACD Histogram: MACD (Moving Averages Convergence / Divergence) issued an up signal on Wed Oct 13 2021 . On Wed Oct 20 the up signal was stronger again which indicates more upside ahead but also reaching into overbought readings.
- Settings: For MACD Histogram, I am using the Fast Points set at 13, Slow Points at 26 and Smoothing at 9.
Ultimate Oscillator: The Ultimate Oscillator is rising and signaling overbought.
- Settings: The Ultimate Oscillator settings are: Period 1 is 5, Period 2 is 10, Period 3 is 15, Factor 1 is 4, Factor 2 is 2 and Factor 3 is 1. These are not the default settings but are the settings I use with the S&P 500 chart set for 1 to 3 months.
Slow Stochastic: The Slow Stochastic has an up signal in place and into extreme overbought readings.
Settings: For the Slow Stochastic I use the K period of 14 and D period of 3. The Slow Stochastic tries to predict the market direction further out than just one day.
Relative Strength Index: The RSI signal is rising for a sixth day and into overbought readings.
- Settings: The relative strength index is set for a period of 5 which gives it 5 days of market movement to monitor. It is often the first indicator to show an overbought or oversold signal.
Rate of Change: The rate of change signal is rising for a sixth day.
- Settings: Rate Of Change is set for a 21 period. This indicator looks back 21 days and compares price action from the past to the present. With the Rate Of Change, prices are rising when signals are positive. Conversely, prices are falling when signals are negative. As an advance rises the Rate Of Change signal should also rise higher, otherwise the rally is suspect. A decline should see the Rate Of Change fall into negative signals. The more negative the signals the stronger the decline.
Support and Resistance Levels To Be Aware Of:
4550 is resistance
4525 is resistance
4500 is resistance
4490 is support
4475 is support
4450 is support
4400 is support
4370 is light support
4350 is light support
4300 is light support
4290 is light support
4270 is light support
4250 is good support
4225 is light support
4200 is good support
4175 is light support
4150 is light support
4100 is good support
Stock Market Outlook for Tomorrow – Thu Oct 21 2021
For Thursday the market is extremely overbought and in need of consolidating the gains from the rally. There is a good chance for weakness and dips on Thursday but the problem remains that investors who missed the rally will use any weakness to jump into stocks at present. That means dips on Thursday will probably be short-lived as they were on Wednesday. So while the technical indicators and chart are flashing a sideways to down day for Thursday, buyers probably have a different idea. We could still see another positive day on Thursday.
Stock Market Outlook Archives
Stock Market Outlook For Wed May 6 2026 – Choppy But Higher Still

Morning Investing Strategy Notes for Tue May 5 2026

Stock Market Outlook For Tue May 5 2026 – Overbought and Lower

Morning Investing Strategy Notes for Mon May 4 2026
Stock Market Outlook For Mon May 4 2026 – Dips Likely With Possible Lower Close

Morning Investing Strategy Notes for Fri May 1 2026
Stock Market Outlook For Fri May 1 2026 – Overbought But Higher

Morning Investing Strategy Notes for Thu Apr 30 2026
Stock Market Outlook For Thu Apr 30 2026 – Dips Likely Possible Lower Close
Morning Investing Strategy Notes for Wed Apr 29 2026
Stock Market Outlook For Wed Apr 29 2026 – Choppy But Higher Ahead Of More Earnings

Morning Investing Strategy Notes for Tue Apr 28 2026