
 Prior Trading Day Summary:
On Wed Nov 8 2023 stocks opened the day lower but continued to find enough buyers to move higher. Intraday the SPX came within 9 points of reaching 4400 and closed up 4 points to 4378.
The NASDAQ rose 10 points, closing at 13650.
Volumes were a little lighter but the closing candlestick points to a potential higher move on Thursday.
Let’s review the closing technical indicators from Wed Nov 8 2023 to see what to expect for Thu Nov 9 2023.
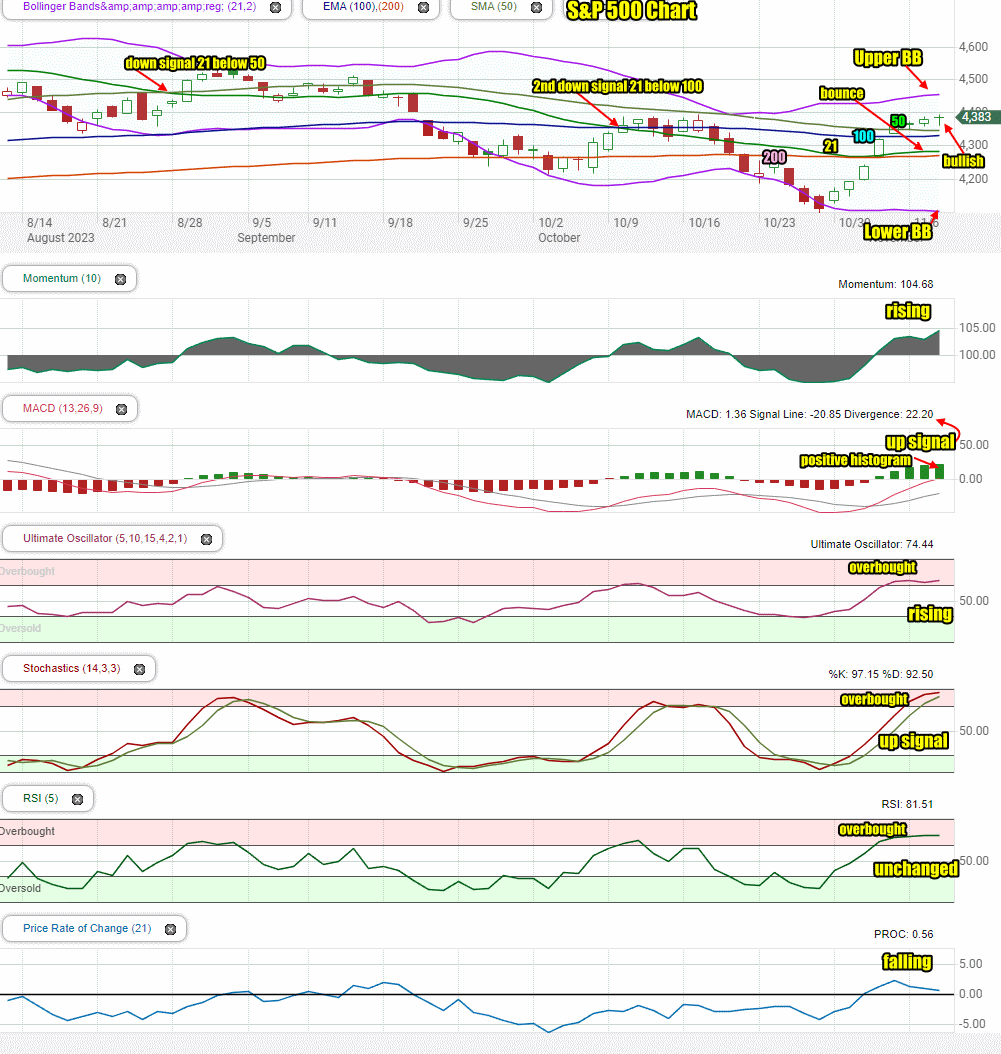
Stock Market Outlook: SPX Closing Chart For Wed Nov 8 2023
The index closed above all major moving averages on Wednesday for a fourth day.
The closing candlestick ended the day above 4350 with long shadows which often indicates either a drop coming on Thursday or a break out higher.
The 21 day moving average bounced off the 200 day on Thursday last week but is starting to dip back which is bearish.
The 50 and 100 day moving averages back rising while the 200 day is moving sideways.
The Lower Bollinger Band is turning lower which is bullish. The Upper Bollinger Band is turning higher. This too is bullish.
The S&P chart is bearish but continues to indicates the bounce has further to run.
Stock Market Outlook review of Wed Nov 8 2023
Stock Market Outlook: Technical Indicators Review
Momentum: Momentum is rising and positive.
|
MACD Histogram: MACD (Moving Averages Convergence / Divergence) issued an up signal on Thu Nov 2. On Wed Nov 8 2023 the close saw a strong up signal.
|
Ultimate Oscillator: The Ultimate Oscillator is rising and positive. It is overbought.
|
Slow Stochastic: The Slow Stochastic has an up signal in place and is overbought.
|
Relative Strength Index: The RSI signal is unchanged and positive. It is overbought.
|
Rate of Change: The rate of change signal is falling and positive. It is signaling a dip for Thursday or Friday should be expected.
|
Stock Market Outlook: Support and Resistance Levels |
| 4425 is resistance |
| 4410 is resistance |
| 4400 is resistance |
| 4390 is resistance |
| 4375 is resistance |
| 4350 is support |
| 4325 is support |
| 4300 is support |
| 4275 is light support |
| 4250 is light support |
| 4235 is light support |
| 4225 is support |
| 4200 is good support |
| 4185 is support |
| 4175 is support |
| 4150 is good support |
Stock Market Outlook for Thu Nov 9 2023
For Thursday stocks are still overbought but the market move higher on Wednesday from the morning selling is a bullish signal and advises to stay cautious but also expect a higher close.
The SPX must hold above 4300 to keep the rally alive.
All the technical indicators gained some strength except for the Rate Of Change which is falling. Normally this indicates a bit of weakness and a chance for a lower day on Thursday.
There was nothing new out of Fed Chair Powell’s speech yesterday. He also speaks today at the IMF meeting at 2:00 PM. This is a panel gathering and nothing new is expected.
Thursday should see dips again and choppy trading but there is still a chance for a higher close.
Potential Economic and Political Market Moving Events
This week bond markets are closed on Friday which often assists the bulls on Friday. HIstorically this is a strong week for stocks. There are few economic reports this week that would disrupt the bulls. A number of Fed officials speak but nothing new is expected. Fed Chair Powell speaks on Wed and Thursday at IMF.
Monday:
There are no economic reports
Tuesday:
8:30 Trade Deficit is expected at -$59.8 billion but came in at -$61.5 billion.
3:00 Consumer credit os expected to be $9.5 billion
Wednesday:
9:15 Powell delivers opening remarks
10:00 Wholesale inventories are expected to be flat at 0.0%
Thursday:
8:30 Weekly Initial Unemployment Insurance Claims are expected to be 220,000
2:00 Fed Chair Powell is on a panel at the IMF conference