
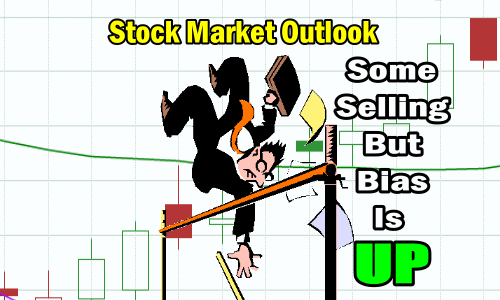
Wednesday Oct 31 was the first back-to-back up day in October since the month started. It also saw good volume and decent buying activity. All three indexes ended with solid gains but there are some signals to be aware of for Thursday.
Stock Market Outlook Chart Comments At The Close on Wed Oct 31 2018
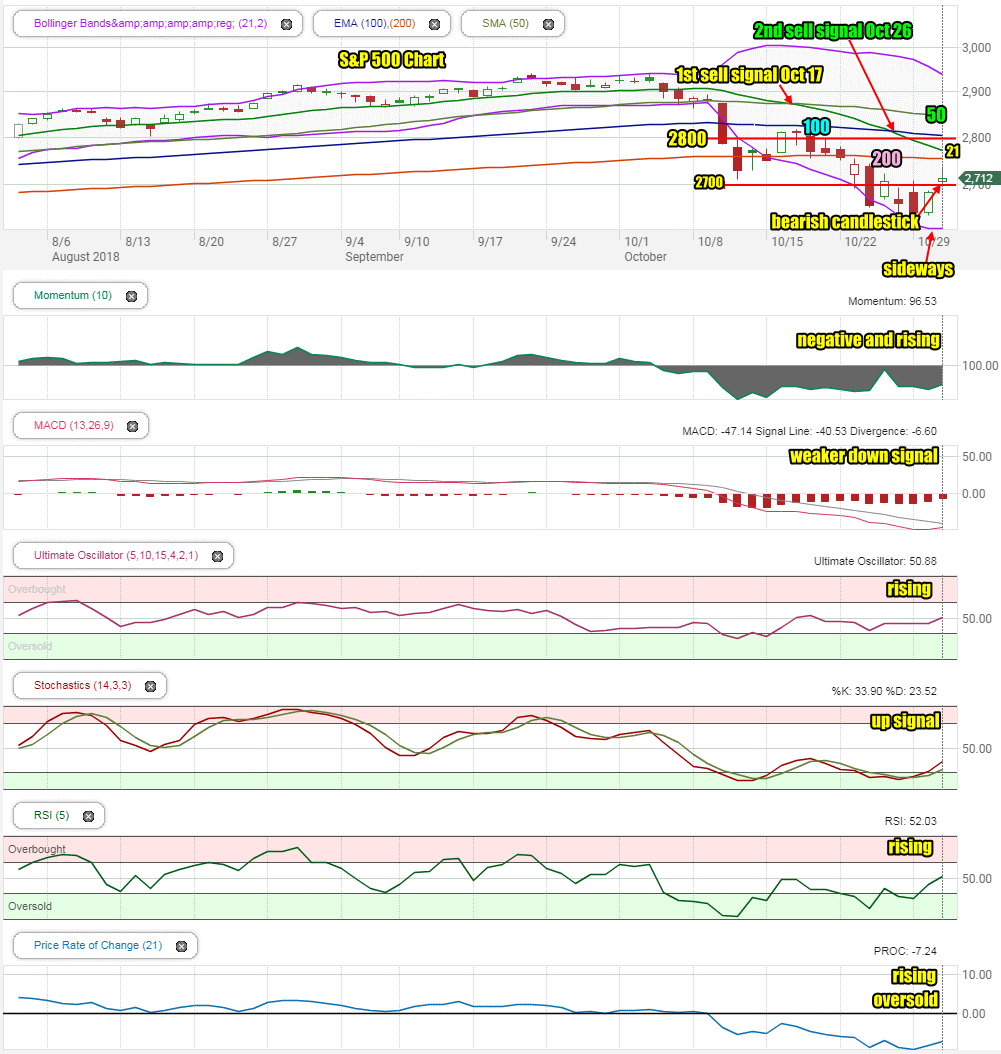
The index closed well below the 200 day moving average on Wednesday but perhaps more importantly, it closed not at the highs of the day. More on that below in the market outlook for Thursday.
The candlestick for Thursday is bearish, but members know that Thursday or Friday or even both days, could be bearish if they read the State Of The Correction article from Tuesday night.
All the major moving averages are falling lower with the 21 day falling still closer to the 200 day moving average. If it crosses below it, the market will issue a third sell signal. Note though that the Lower Bollinger Band has turned sideways and in no longer falling, a bullish sign. Meanwhile the Upper Bollinger Band is still falling which we will have to keep an eye on, but for now the Bollinger Bands is indicative of the potential for no further drops deeper.
The close on Wednesday places the S&P above the 2700 level which was important and if held, it starts to break the trend of lower highs.
Stock Market Outlook review of Wed Oct 31 2018
Stock Market Outlook: Technical Indicators Review:
Momentum: Momentum is negative and rising.
- Settings: For momentum I use a 10 period when studying market direction.
MACD Histogram: MACD (Moving Averages Convergence / Divergence) issued a down signal on Wednesday Sep 26. The down signal was much weaker on Wednesday by the close.
- Settings: For MACD Histogram, I am using the Fast Points set at 13, Slow Points at 26 and Smoothing at 9.
Ultimate Oscillator: The Ultimate Oscillator signal is rising.
- Settings: The Ultimate Oscillator settings are: Period 1 is 5, Period 2 is 10, Period 3 is 15, Factor 1 is 4, Factor 2 is 2 and Factor 3 is 1. These are not the default settings but are the settings I use with the S&P 500 chart set for 1 to 3 months.
Slow Stochastic: The Slow Stochastic has an up signal in place for Thursday and is no longer oversold.
- Settings: For the Slow Stochastic I use the K period of 14 and D period of 3. The Slow Stochastic tries to predict the market direction further out than just one day.
Relative Strength Index: The RSI signal is rising.
- Settings: The relative strength index is set for a period of 5 which gives it 5 days of market movement to monitor. It is often the first indicator to show an overbought or oversold signal.
Rate of Change: The rate of change signal is rising and is still oversold.
- Settings: Rate Of Change is set for a 21 period. This indicator looks back 21 days and compares price action from the past to the present. With the Rate Of Change, prices are rising when signals are positive. Conversely, prices are falling when signals are negative. As an advance rises the Rate Of Change signal should also rise higher, otherwise the rally is suspect. A decline should see the Rate Of Change fall into negative signals. The more negative the signals the stronger the decline.
Support Resistance Levels To Be Aware Of:
2900 was good support – this will be strong resistance
2860 was good support – this will be resistance
2830 was light support and will be light resistance
2795 is resistance
2745 to 2750 are light resistance
2725 is light resistance and was revisited today although the market closed below it at 2712.
2700 is important support and was retaken today.
2675 is light support and was broken on Monday for the third time.
2650 is light support which also was broken on Monday.
2620 is light support which was tested and the market moved back above it by the close.
2600 is strong support which held the market from falling further, late Monday afternoon in the market plunge.
There is good support at the 2550 level from where the market bounced back from the recent correction low on Feb 9.
The S&P has light support at 2480. It also has light support at 2450 and good support at 2425. Below that there is some support at 2400, 2380, 2350.
2300 has the most support at present but would represent a full correction of 641 points as a drop to this level would be 21% and just 5% away from a bear market signal ending the bull market from 2009.
Stock Market Outlook for Tomorrow – Thu Nov 1 2018
The rally on Wednesday was important. It was the first back-to-back rally for the month.
The fact that the market closed well off the highs is a bit discouraging but it is better than the S&P closing at the highs, which is almost always followed by more selling.
Closing well off the highs in a correction often sets the next day up for some weakness and then another push higher. A drop below 2700 would not be unusual for this stage of the rally but it would be expected that the index would recover 2700 before the close.
Thursday then will see weakness and perhaps even some deeper than expected dips, but a push back up should occur and keep the rally alive.
Stock Market Outlook Archives
Stock Market Outlook For Wed May 6 2026 – Choppy But Higher Still

Morning Investing Strategy Notes for Tue May 5 2026

Stock Market Outlook For Tue May 5 2026 – Overbought and Lower

Morning Investing Strategy Notes for Mon May 4 2026
Stock Market Outlook For Mon May 4 2026 – Dips Likely With Possible Lower Close

Morning Investing Strategy Notes for Fri May 1 2026
Stock Market Outlook For Fri May 1 2026 – Overbought But Higher

Morning Investing Strategy Notes for Thu Apr 30 2026
Stock Market Outlook For Thu Apr 30 2026 – Dips Likely Possible Lower Close
Morning Investing Strategy Notes for Wed Apr 29 2026
Stock Market Outlook For Wed Apr 29 2026 – Choppy But Higher Ahead Of More Earnings

Morning Investing Strategy Notes for Tue Apr 28 2026